Your Scrum team finishes Sprint #4. The board shows completed tasks. But one question remains unanswered: are we actually on track to finish the whole project on time? Burndown charts exist to answer this, yet most teams build them manually every sprint. They copy numbers from the backlog, calculate remaining points by hand, and never see the velocity trend until the retrospective.
The velocity burndown chart template solves this by automating the entire tracking process. You enter feature points once. Then you distribute completed points across sprints. The template calculates baseline points (linear progress), actual points remaining, and velocity per sprint. A built‑in commentary explains what the numbers mean.
Checkout online Velocity Burndown Calculator Tool available for free.
What Is the Velocity Burndown Chart Template?
This template is a dedicated Excel workbook for agile project tracking. It serves Scrum masters, product owners, project managers, and development teams who need a visual of progress against a fixed backlog.
The template contains one master sheet with three distinct areas:
- Feature table – List each feature, its total points, and how many points you completed in each sprint (up to 5 sprints).
- Baseline Points – A calculated row showing where the project should be if you completed points linearly across sprints.
- Actual Points & Velocity – Remaining points after each sprint, plus the velocity (points completed) per sprint.
Additionally, the template includes a Commentary section that interprets the example data. This teaches you how to read your own project’s performance.
Baseline vs. Actual Burndown Without Formulas
The template uses three calculated rows at the bottom of the feature table:
Baseline Points
Formula example for Sprint #5 (cell C17): =B17-($B$17/5)
This takes the total points (B17) and subtracts one fifth of that total. It assumes you finish exactly 20% of the work each sprint. Consequently, the baseline creates a straight downward line from total points to zero.
Actual Points
Formula for Sprint #5 (cell C18): =B18-SUM(C6:C16)
This subtracts all points completed in Sprint #5 (from the feature rows) from the previous actual points total. It shows true remaining work after each sprint.
Velocity Points
Formula for Sprint #5 (cell C19): =B18-C18
This calculates how many points your team actually completed in that sprint (the difference between actual points before and after the sprint).
These three rows together create the classic burndown chart. The template provides the numbers. You provide the visual chart (insert a line chart with Baseline and Actual series).
Multi‑Sprint Tracking Across Five Sprints
The template supports up to five sprints (Sprint #1 to Sprint #5). Each sprint has its own column. For each feature, you enter the points completed in that sprint.
The coffee shop build example shows realistic distribution:
| Feature | Total | Sprint #5 | Sprint #4 | Sprint #3 | Sprint #2 | Sprint #1 |
| Sign the lease | 10 | 10 | 0 | 0 | 0 | 0 |
| Complete dry walling | 25 | 10 | 15 | 0 | 0 | 0 |
| Install appliances | 35 | 5 | 15 | 15 | 0 | 0 |
This structure captures real‑world scenarios where work spans multiple sprints. A feature can start in Sprint #2, continue in Sprint #3, and finish in Sprint #4. The template handles partial completions automatically.
Furthermore, the Comments column (column H) allows you to annotate each feature. For example, the template includes: “A snag on sprint #2 was fixed on sprint #1” for the social media campaign. These notes become invaluable during sprint retrospectives.
Velocity Calculation and Interpretation
Velocity measures how many points your team completes per sprint. The template calculates it automatically in row 19.
Looking at the example data:
- Sprint #5 velocity = 37 points (from B18 – C18)
- Sprint #4 velocity = 38 points
- Sprint #3 velocity = 48 points
- Sprint #2 velocity = 23 points
- Sprint #1 velocity = 26 points
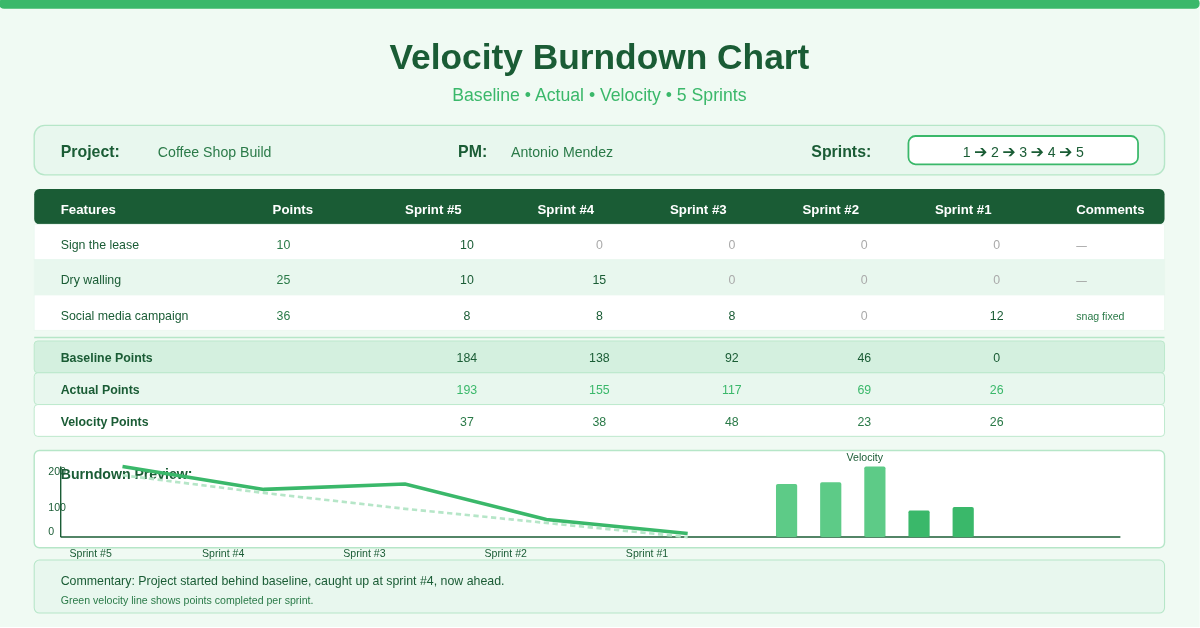
The Commentary explains: “The project started behind the planned points, but was able to catch up at the end of the 4th sprint, and since then has been ahead of the plan. The green velocity line denotes the number of points achieved in each sprint.”
This narrative is the real value. Numbers alone do not tell a story. The template provides the numbers and teaches you how to read them. When velocity dips (Sprint #2 at 23 points), you investigate. When velocity spikes (Sprint #3 at 48 points), you celebrate and also check for overcommitment.
How Do the Baseline Formulas Actually Work?
The Baseline Points row uses a simple linear assumption: divide total points evenly across five sprints.
In the example, total points (B17) = 230. One fifth of 230 is 46. Therefore, after Sprint #5, baseline remaining points = 230 – 46 = 184. After Sprint #4, baseline remaining = 184 – 46 = 138. And so on.
The formula =B17-($B$17/5) uses an absolute reference to total points (17). When copied to the right, it subtracts the same fixed amount (46) each time. This creates a straight line.
To adapt this for your project: If you have more or fewer than 5 sprints, change the denominator. For 10 sprints, replace /5 with /10. For 8 sprints, use /8. The template gives you a working example you can modify.
The Actual Points row uses =B18-SUM(C6:C16). B18 holds the total actual points (same as total feature points). Then it subtracts the sum of all points completed in that sprint column. Because the formula uses relative references, copying it to the right subtracts the correct sprint column each time.
Practical Use Cases
Scrum Master for a Software Team – Enter each user story as a feature with story points. After each sprint, fill the points completed per story. The Actual Points row shows remaining work. Add a line chart. Share the burndown in sprint review.
Construction Project Manager – Use the template for physical deliverables (dry walling, appliances, furniture). Assign points based on estimated labour hours. Track progress across monthly sprints. The velocity row reveals if your team is accelerating or burning out.
Product Owner Managing a Marketing Launch – List campaign deliverables (ads, emails, landing pages). Points represent hours or task complexity. The template shows which sprint fell behind (like Sprint #2 in the example) so you can adjust future sprint planning.
Agency Owner Tracking Multiple Client Projects – Copy the sheet for each client. Use the Comment column to capture client feedback or blockers. The baseline vs. actual comparison helps you renegotiate deadlines early.
Student Working on a Capstone Project – Break your thesis or portfolio into 5 phases. Assign points to each phase. Track weekly progress. The velocity row tells you if you are working consistently or cramming before the deadline.
How to Set Up and Start Using the Template
Follow these steps to track your agile project:
- Download the Excel file from the link below. Open the Velocity sheet.
- Replace the example project name, PM, and update date with your own details.
- List your features in column A (starting row 6). Use clear, actionable names.
- Assign story points or effort hours in column B (Points).
- For each sprint column (C through G: Sprint #5 to Sprint #1), enter the points completed for that feature in that sprint.
- Enter 0 if no work happened in that sprint for that feature.
- Partial completions are allowed (e.g., 5 out of 25 points).
- Do not edit rows 17–19. These are the Baseline Points, Actual Points, and Velocity rows. They update automatically.
- Insert a line chart:
- Select row 17 (Baseline Points) and row 18 (Actual Points) for sprints #5 to #1.
- Insert → Line Chart.
- Read the Commentary row (row 30) to understand what your numbers reveal.
- Add your own observations in the Comments column for any feature that had blockers or surprises.
Update the sheet every sprint. The template keeps historical data, so you can compare sprint over sprint.
Download Your Free Velocity Burndown Chart Template
Stop guessing whether your agile project is on track. Start seeing the real story behind your sprint points. Download the free velocity burndown chart template below. It works with Excel 2016, 2019, 365, and Google Sheets. The baseline formulas and velocity calculations work immediately.