
Most HR tables store the org chart in two columns. One holds the employee id, the other holds the manager id. That layout is compact, yet it hides the shape of the chart. A simple question becomes hard. Who reports up to a given director, at any depth? DAX PATH functions answer it. They flatten a parent-child hierarchy into a readable trail you can filter, count, and level.
This guide shows how to work with org charts in Power Pivot. First, it explains the PATH family in plain terms. Then it builds the columns that flatten a hierarchy. Real examples and a full troubleshooting section follow. By the end, you will slice an org chart by level and by branch.
The PATH Family at a Glance
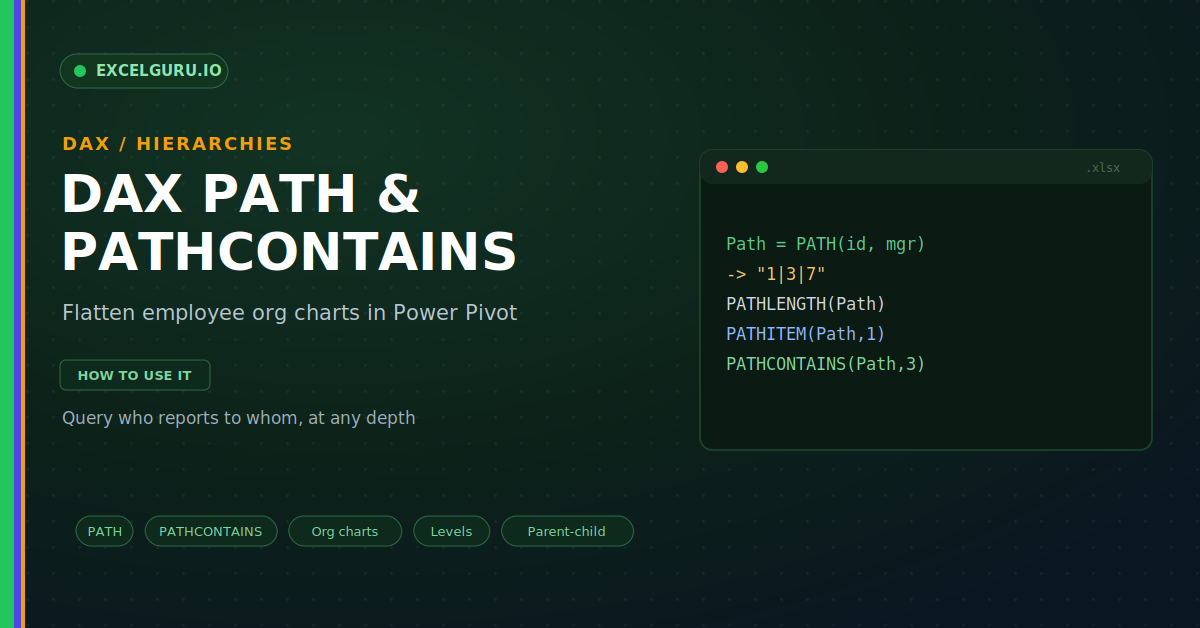
PATH turns a parent-child link into a trail of ids. It walks from the top down to the current row. The result is a single delimited string. Notably, the other functions read that string. The infographic below shows the idea on a small chart.
For employee 7, PATH returns the text "1|3|7". That trail lists every manager above them. From it, PATHLENGTH counts three levels. Meanwhile, PATHCONTAINS tests whether a person sits under a chosen manager.
What Each Function Does
Five functions cover almost every hierarchy need. Each one reads the path string in its own way. Together they flatten and query the chart. So it helps to know them at a glance.
Example 1: Build the Path Column
Start by flattening the hierarchy into a trail. You add one calculated column with PATH. It reads the id and the manager id. Then every row gains its own path.
Example 2: Find Each Person's Level
Depth matters for many reports. It shows how far a person sits from the top. PATHLENGTH gives that number straight from the trail. So one short column adds the level.
Example 3: Split the Path into Columns
A flat hierarchy needs one column per level. PATHITEM reads each id by position. You add a column for level one, two, and three. Then a matrix can drill down cleanly.
Example 4: Show Names Instead of IDs
Ids are precise but hard to read. Managers want names in the report. LOOKUPVALUE turns each id into a name. Therefore each level column reads clearly.
Example 5: Test Membership with PATHCONTAINS
Often you ask who sits under one manager. PATHCONTAINS answers that in a flag. It checks whether a manager id appears in the trail. So you can mark every report of a director.
Example 6: Count All Reports Under a Manager
Managers often want a total headcount below them. A measure with PATHCONTAINS delivers it. It counts rows whose trail holds the chosen id. Consequently, the number covers every depth.
Troubleshooting PATH Hierarchies
All three problems below are common with org charts. Each has a clear cause and a quick fix.
PATH throws a circular reference error
This means the chain loops back on itself somewhere. A row may list itself as its own manager, for example. Two people may also report to each other by mistake. First, check the top row, since the CEO should have a blank manager id. Then hunt for any pair that points both ways. Because PATH must climb to a single top, any loop breaks it. Fixing the data removes the error at once.
The id types do not match
PATH needs the employee id and manager id to share a type. A number in one column and text in the other will fail. So confirm both columns use the same data type. Whole number is the safest choice for ids. Also remove stray spaces from any text ids before you convert them. With matching types, PATH links each child to its parent cleanly.
Shallow branches leave blank levels
A ragged chart has branches of different depths. So PATHITEM returns blank for the missing tiers. That blank is normal, yet it can look messy in a matrix. To tidy it, wrap the column in an IF that shows a dash. Alternatively, carry the last known name down to fill the gap. Either way, the report reads cleanly across uneven branches.
Frequently Asked Questions
- What does the DAX PATH function return?+PATH returns a text trail of ids from the top down. For a deep employee, it might read "1|3|7". Each id is one manager in the chain. From that trail, the other PATH functions read levels and members.
- How is PATHCONTAINS useful for org charts?+PATHCONTAINS tests whether a manager id sits in the trail. Therefore it flags everyone under a chosen leader. You can use it to count reports at any depth. It also drives filters for a sub-tree.
- Do I need one table for the hierarchy?+Yes, the employee id and manager id must share one table. Each manager id must also exist as an employee id. Because of this, PATH can climb to the top. A split across tables will not work.
- Why does PATH show a circular reference error?+This happens when the chain loops on itself. A row may name itself as manager, for instance. Two rows may also point at each other. Fix the data so every trail ends at one top.