Ranking data is one of the most common tasks in Power Pivot and Power BI. RANKX is the DAX function built for it. It ranks a value within a set you define. Unlike COUNTROWS+EARLIER, RANKX works inside measures, handles ties, and gives precise control over sort direction and tie mode.
This guide covers the RANKX syntax and the TIEs and ORDER arguments. Six examples follow: sales rep ranking, tied values with DENSE and SKIP, ranking inside a category, filtered ranking with ALLSELECTED, percentage rank, and a top-N filter measure.
RANKX Arguments Explained
RANKX takes up to five arguments. The first two are required. The remaining three are optional and default to safe values that cover most use cases.
| Argument | Required | What it controls |
|---|---|---|
| table | Yes | The set of rows to rank against. Typically ALL(Column) or ALLSELECTED(Column). |
| expression | Yes | The measure evaluated for each row. Usually something like [Total Sales]. |
| value | Optional | The value to rank. Almost always omitted — defaults to the current context result. |
| order | Optional | DESC (default) = highest is rank 1. ASC = lowest is rank 1 — useful for costs or defects. |
| ties | Optional | SKIP (default) = shared rank, next rank skips. DENSE = consecutive ranks, no gaps. |
Examples 1–4: RANKX in Practice
The simplest RANKX measure ranks the current row’s sales against all reps. ALL(Sales[SalesRep]) provides the full comparison set. The highest revenue gets rank 1 by default.
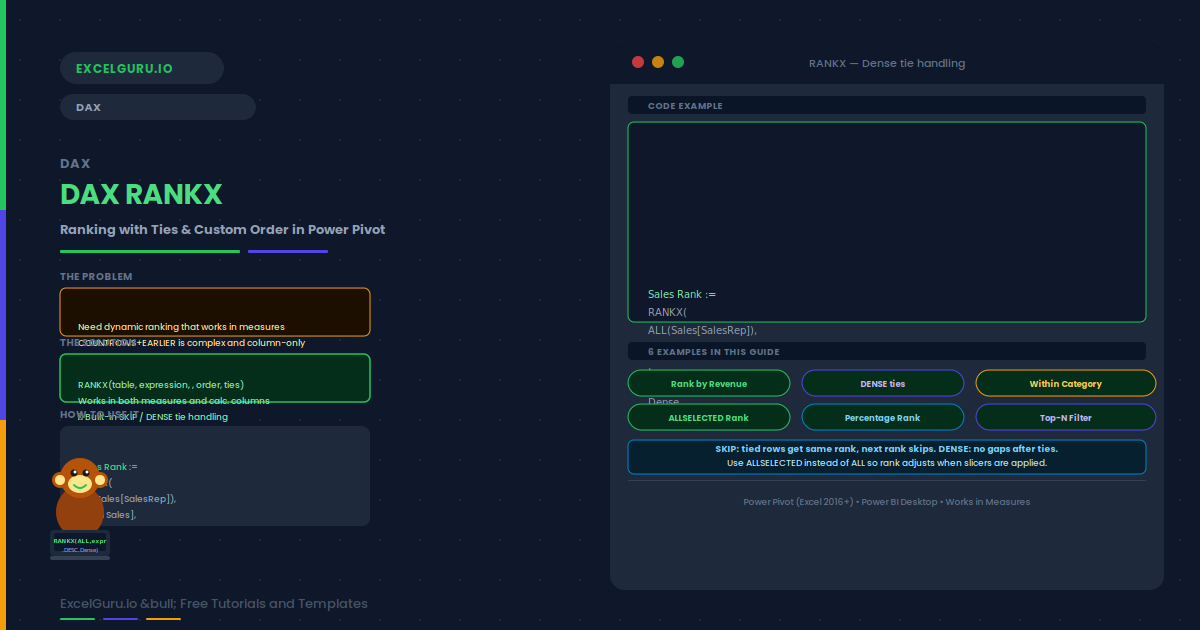
When two reps have identical revenue, both receive the same rank. Specifically, the tie mode determines what happens next. DENSE produces consecutive numbers without gaps. SKIP skips rank numbers after a tie. For user-facing leaderboards, DENSE is therefore the better choice.
To rank within a category, use ALLEXCEPT in the table argument. This tells RANKX to compare only against rows in the same category. For example, regions rank separately within each product group. The result is a separate rank 1 for each product’s top region.
ALLSELECTED makes RANKX rank only against currently visible rows. Additionally, the rank updates automatically as the user changes filters. This is therefore the right approach for interactive reports — rank 1 is always the top visible performer.
Examples 5–6: Percentage Rank and Top-N Filter
A percentage rank expresses position as a fraction of the total. Rank 1 of 20 is the 95th percentile. RANKX combined with COUNTROWS produces this measure without a helper column. It is especially useful in HR and performance reporting contexts.
A True/False measure based on RANKX filters the PivotTable to the top N items. Add the rank measure, then use Value Filters in the PivotTable to show only rows where the flag is TRUE. The result is a dynamic top-5 list that updates on every refresh.
Common Issues and How to Fix Them
RANKX returns the same rank for every row
The expression argument is likely returning the same value in every row. Verify that your measure changes as RANKX iterates each row in the ranking table. If the measure uses ALL internally and returns a constant, every row gets rank 1. Remove any ALL calls from inside the expression argument.
RANKX returns blank instead of a rank number
RANKX returns blank when the expression evaluates to blank or zero for the current context. A product-region combination with no transactions is a common cause. Also check whether your ALLSELECTED table includes the current item. Use IFERROR or IF(ISBLANK(...)) to provide a fallback value.
Frequently Asked Questions
-
How does RANKX handle tied values?+RANKX handles ties through its fifth argument. SKIP (the default) assigns the same rank to tied rows and skips the following rank numbers. For example, two rows tied at rank 2 both get rank 2, and the next row gets rank 4. DENSE assigns the same rank but uses consecutive numbers, so the next row after the tie gets rank 3. Use Dense for leaderboards and Skip for sports-style competition ranking.
-
What is the difference between RANKX with ALL and ALLSELECTED?+ALL ranks against the full table regardless of slicers. The rank therefore remains stable as the user filters. ALLSELECTED ranks only against rows visible after slicers are applied. The rank adjusts dynamically. Use ALL for absolute ranking across the full dataset. Use ALLSELECTED for relative ranking within the user’s current filtered view.
-
Can RANKX rank in ascending order?+Yes, this is straightforward. Pass ASC as the fourth argument. The default is DESC (highest = rank 1). ASC makes the lowest value rank 1 — useful for defect rates, response times, or costs where lower is better. For example, RANKX(ALL(Products[Name]), [DefectRate],, ASC) ranks the product with the fewest defects as rank 1.
-
Can I use RANKX in a calculated column?+Yes. In fact, RANKX works in both measures and calculated columns. In a calculated column, omit the third argument — DAX uses the current row’s expression result automatically. A calculated column stores a persistent rank value. A measure recalculates dynamically based on the current filter context.