
Key takeaways
- Excel's
FORECAST.ETSis a single method and isn't available on Excel for the web, Mac, iOS, or Android. - Forecast Studio compares moving average, linear trend, Holt, and Holt-Winters and picks the winner by measuring error on your own data.
- It reports the backtest MAPE (accuracy) so you know how much to trust the forecast.
- Every forecast comes with a 95% confidence band that widens the further out you look.
- It's free, open-source (MIT), and downloadable from GitHub.
Excel Forecast Studio is a free, open-source tool that forecasts a column of numbers into the
future — smarter than Excel's built-in FORECAST.ETS. It compares several methods,
automatically picks the most accurate one by backtesting your data, and projects future
periods with a 95% confidence band. This guide explains how forecasting works, why Excel's own function
falls short, and how to download and run the tool in a couple of minutes.
Why forecasting in Excel is harder than it looks
Dragging a trend line across a chart feels like forecasting, but it quietly assumes your data is a straight line. Real business data isn't: sales rise and fall with the seasons, growth speeds up and slows down, and noise hides the signal. Pick the wrong model and your "forecast" is confidently wrong.
Excel added FORECAST.ETS to help — a solid exponential-smoothing method. But it has real
limits: it's a single method (you can't compare alternatives), it needs evenly-spaced dates and
2–3 full seasonal cycles to work well, its accuracy degrades quickly beyond a cycle or two, and the
handy Forecast Sheet button (and FORECAST.ETS.CONFINT) simply doesn't
exist on Excel for the web, Mac, iOS, or Android. If you live in those versions, you're stuck.
What Forecast Studio does differently
Instead of betting on one method, Forecast Studio tries several and lets the data decide:
| Method | Best for |
|---|---|
| Moving average | Noisy data with no real trend |
| Linear trend | Steady growth or decline |
| Holt (double smoothing) | A trend that changes over time |
| Holt-Winters (triple smoothing) | Repeating seasonal patterns |
It picks the winner by backtesting — not by guessing
Here's the important part. Forecast Studio holds out the tail of your series, forecasts it with each method, and measures the error (MAPE — mean absolute percentage error). The method that would have predicted your recent, real data most accurately is the one it uses. You're not hoping a model fits; you're choosing the one that demonstrably does.
It's honest about uncertainty
A single forecast line is a comforting lie. Forecast Studio adds a 95% confidence band that widens the further ahead you look — because the future genuinely gets murkier. Treat the band, not the line, as the real answer.
How to download & set up (about 2 minutes)
The tool is free and open-source on GitHub. You'll need Python 3.9 or newer.
- Download the code. Clone the repository (or click Code → Download ZIP on GitHub):
git clone https://github.com/Synth88Labs/excel-forecast-studio.git cd excel-forecast-studio - Install the two dependencies (pandas & openpyxl):
pip install -r requirements.txt - Run it on your data — a CSV or Excel file with a column of numbers:
python forecast.py your_data.csv --value amount --periods 12 --season 12
⬇️ Get Excel Forecast Studio on GitHub (free)
--season to your cycle length — 12 for
monthly-with-yearly seasonality, 7 for daily-with-weekly. Leave it off if your data has no
seasonality. Use --date month to label the forecast with real future dates.
A worked example
The repo includes 36 months of seasonal sales. Running the tool on it:
python forecast.py sample_data/sales.csv --value amount --date month --periods 12 --season 12

Excel Forecast Studio
  Data points: 36   Forecasting: 12 periods   Season: 12
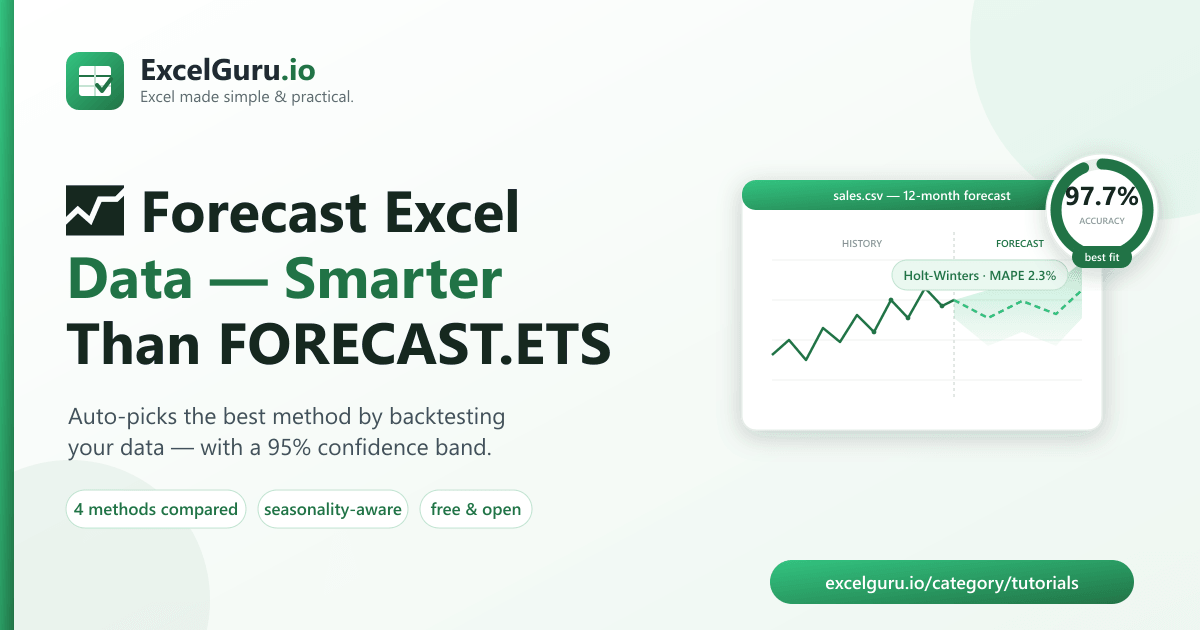
  Method chosen: Holt-Winters (seasonal)   Backtest MAPE: 2.3%
  Next value: 444.63  (95% CI 435.90 – 453.36)
It detected the yearly seasonality, chose Holt-Winters over the flat and linear baselines because it
backtested most accurately (2.3% error), and projected the seasonal cycle forward — plus a
date, forecast, lower_95, upper_95 file you can chart or paste back into Excel.
Common use cases
- Sales & revenue forecasting — project the next 6–12 months with seasonality.
- Demand planning — forecast units to inform purchasing.
- Web traffic / signups — extend a trend with weekly seasonality (
--season 7). - Budgeting — a defensible baseline instead of "last year + 10%".
What a forecast can't do
Every forecast assumes the future resembles the past. A new product launch, a price change, or an external shock won't be predicted by any statistical model — including this one. That's exactly why the confidence band matters: it tells you the range of "normal," so you can spot when reality breaks out of it.
Frequently asked questions
Is Excel Forecast Studio free?
Yes — it's open-source under the MIT license, free for personal and commercial use. Download it from GitHub.
Do I need to know Python?
No. You install Python once, then run a single command. The README has copy-paste examples.
How is it better than Excel's Forecast Sheet?
It compares multiple methods (not just one), tells you the accuracy via backtesting, adds a confidence band, and runs on any platform — including where Excel's Forecast Sheet isn't available.
What file types does it read?
.csv and .xlsx. Point it at the value column with --value.
How many data points do I need?
At least 3 to forecast at all; for seasonal forecasting you want at least two full cycles (e.g. 24 months for yearly seasonality).
How do I know if the forecast is any good?
Check the reported backtest MAPE — lower is better. Under ~10% is usually a reliable forecast; a high value means your data is hard to predict, so lean on the confidence band.
Summary
Forecasting shouldn't mean trusting one formula and hoping. Excel Forecast Studio compares proven methods, picks the most accurate one on your own data, and forecasts with an honest confidence band — free, open-source, and on any platform. Download it from GitHub and get a defensible forecast in a couple of minutes.