
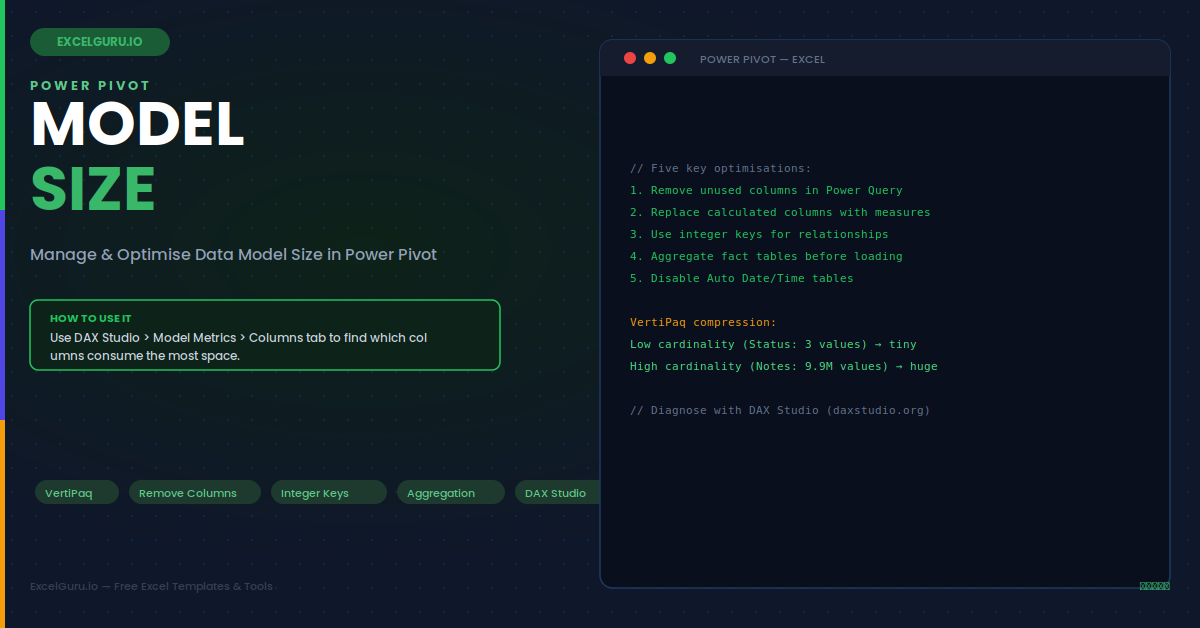
A Power Pivot workbook that opens slowly or crashes during refresh is almost always the result of a bloated Data Model. Data Model size is controlled by five factors: loaded table count, column count, data type choices, column cardinality, and unnecessary calculated columns. Each factor multiplies the others. A 10-million-row table with 50 columns and two high-cardinality text fields can consume 15 times more memory than the same data optimised correctly. This guide covers how to measure model size, diagnose the biggest contributors, and apply the six most effective optimisations to reduce size and improve refresh speed.
How VertiPaq Stores Data — Why Column Count Matters More Than Row Count
Power Pivot uses a column-store engine called VertiPaq. Unlike a row-store database, VertiPaq compresses each column independently using dictionary encoding. Consequently, low-cardinality columns (few distinct values) compress to near nothing regardless of row count. High-cardinality text columns (many distinct values) compress poorly and consume disproportionate memory. Understanding this compression model is essential — it explains why removing a single high-cardinality text column can reduce model size by 60%, while removing 10 low-cardinality columns may have almost no effect.
Measuring Current Model Size
Before optimising, measure the current model size to establish a baseline and identify the largest contributors. Two approaches work without any external tools — one inside Power Pivot itself and one using a free community tool that provides precise column-level detail.
Optimisation 1: Remove Unused Columns Before Loading
Every column loaded to the Data Model consumes memory — even columns never used in any measure or relationship. The most effective first step is removing unused columns in Power Query before the table loads to the model. Go to the Power Query editor for each table and use Choose Columns (Home > Choose Columns) to drop everything not needed for measures, relationships, or report filters. Specifically, removing columns in Power Query means they are never loaded to the model at all — far more effective than hiding them in Power Pivot after loading.
Optimisation 2: Hide Columns from Client Tools
Some columns must stay in the model for relationship purposes but should not appear in PivotTable field lists. Rather than deleting these, right-click the column header in Power Pivot and choose "Hide from Client Tools". This keeps the column for DAX calculations and relationships while removing it from the field list users see. Note that hidden columns consume the same memory as visible columns — so this approach manages the user experience, not the model size. Use it for foreign key columns and fact table columns that relationships require but users should never filter directly.
Optimisation 3: Replace Calculated Columns with Measures
Calculated columns are evaluated at model refresh time and stored in memory for every row. Measures, by contrast, are evaluated at query time and consume no storage at rest. A calculated column on a 10-million-row table adds 10 million stored values to the model. The equivalent measure computes the same result dynamically using zero stored rows. Consequently, any calculation expressible as a measure should be a measure, not a calculated column. Only use calculated columns for values that must be available as slicer filters, relationship keys, or per-row values in table visualisations.
Optimisation 4: Use Integer Keys for Relationships
Relationships between tables are built on key columns. If a fact table relates to a customer dimension using the CustomerName column (text, high cardinality), that key column consumes significantly more memory than an integer CustomerID column. Furthermore, integer lookups in VertiPaq are faster than text lookups, so replacing text relationship keys with integer surrogate keys reduces both model size and query speed. The text column can remain in the dimension table for display — the relationship key only needs to be the integer ID.
Optimisation 5: Aggregate Fact Tables Before Loading
The most dramatic model size reduction comes from aggregating fact tables to the lowest granularity needed for analysis. If the analysis never goes below the daily level, daily aggregates of transaction-level data can be 50–100× smaller than the original. A retail chain with 50 million individual transaction rows might only need daily-store-product aggregates (5 million rows) for Power Pivot reporting. Aggregating in Power Query before loading means the Data Model receives the smaller pre-aggregated table instead of raw transactions, while time intelligence measures remain fully functional.
Optimisation 6: Disable Auto Date/Time Tables
By default, Power Pivot creates a hidden Auto Date/Time table for every date column in every table in the Data Model. Each hidden table replicates the full date hierarchy — Year, Quarter, Month, Day — which can add significant memory overhead when multiple date columns exist. Disabling this feature and using a single shared Date Table instead is the correct approach for any model with more than one or two date columns. The setting is at File > Options > Data > uncheck "Auto Date/Time for new files".
Troubleshooting Model Size Issues
All three issues below are the most common causes of oversized or slow Power Pivot models. Each has a clear diagnosis path and a specific fix.
The workbook file is very large but the source data is not
A large .xlsx file with a Power Pivot model almost always means high-cardinality text columns or unnecessary calculated columns are inflating the Data Model. Open DAX Studio, connect to the Excel model, and run Model Metrics — the Columns tab shows each column's compressed size. Sort by size descending to identify the top contributors. Typically, one or two free-text columns (notes, descriptions, full addresses) account for the majority of the size. Removing them in Power Query and refreshing reduces the file size immediately and measurably.
Model refresh is very slow — minutes instead of seconds
Slow refresh usually means Power Query is loading too many rows or columns that are not needed for the analysis. In Power Query, enable Query Diagnostics (Tools > Start Diagnostics, run a refresh, stop diagnostics) to see which steps and tables consume the most time. Additionally, check whether fact tables are being loaded at transaction granularity when only aggregate granularity is needed. Adding a Group By aggregation step in Power Query before loading is typically the single most effective fix for slow refresh on large fact tables.
PivotTable queries are slow even though the model itself loads quickly
Slow PivotTable queries with a fast-loading model typically indicate expensive measure formulas rather than a storage size problem. Use DAX Studio's Query Plan view to examine the formula's execution plan. Calculated columns or measures using CALCULATE, FILTER, or SUMX iterating over large tables are the most common cause. Replacing these with pre-aggregated values in Power Query, or restructuring the measure to avoid row-context iteration, dramatically improves query speed without changing model size at all.
Frequently Asked Questions
- How do I check the size of my Power Pivot Data Model?+The simplest quick check is to compare the workbook file size against an empty workbook — the difference approximates the Data Model size. For precise column-level analysis, use DAX Studio (free at daxstudio.org) — connect it to the Excel Data Model and go to Home > Model Metrics. The Columns tab shows the exact compressed size of every column in every table, sorted by size. This immediately identifies which columns are the biggest contributors to model size and where optimisation effort will have the most impact.
- Why do text columns make the Power Pivot model so much larger?+Power Pivot uses VertiPaq column-store compression, which builds a dictionary of distinct values for each column and stores an index of references instead of raw values. Low-cardinality columns (few distinct values, like Status with 3 options) compress to near zero because the dictionary is tiny. High-cardinality text columns (many distinct values, like free-text notes) compress poorly because the dictionary contains almost as many entries as rows. Consequently, the compression benefit disappears and the column consumes memory proportional to both the number of distinct strings and the total row count.
- What is the difference between a calculated column and a measure in Power Pivot?+A calculated column is evaluated at model refresh time and stored as a physical column in the Data Model — every row gets a stored value, consuming memory proportional to the row count. A measure is a DAX formula evaluated at query time — it computes results on demand and consumes no stored memory between queries. Calculated columns are appropriate for values needed as slicer filters or relationship keys. Measures are appropriate for any aggregation, KPI, or ratio only meaningful at a summarised level. Converting unnecessary calculated columns to measures is one of the fastest ways to reduce Data Model size.
- How do I reduce Power Pivot model size without losing any data?+Five optimisations reduce model size without removing business data. First, remove unused columns in Power Query before loading — keep only columns needed for measures, relationships, and slicers. Second, convert calculated columns to measures wherever possible. Third, aggregate fact tables to the lowest granularity needed for the analysis. Fourth, replace text relationship keys with integer surrogate keys. Fifth, disable Auto Date/Time and use a single shared Date Table instead. Together, these five changes typically reduce model size by 60–90% on production models that have not been previously optimised.