
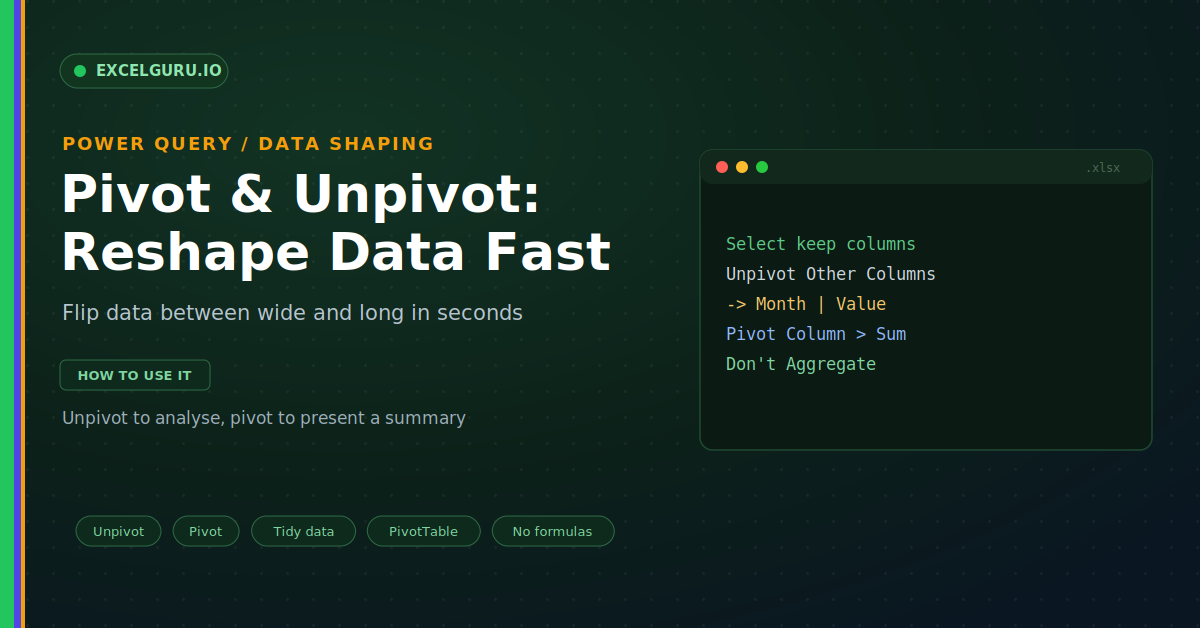
Your data looks fine to the eye. Yet the PivotTable will not build the chart you want. The reason is shape, not content. Many spreadsheets store months or categories across columns. That wide layout reads well, but tools like PivotTables prefer tall, tidy data. Power Query reshapes it in seconds. Its Unpivot and Pivot commands flip data between wide and long without a single formula.
This guide shows how to reshape data the smart way. First, it explains the wide and long layouts. Then it walks through unpivoting, pivoting, and the traps between them. Several worked examples and a full troubleshooting section follow. By the end, you will reshape any table to fit the job.
Wide Data and Long Data
Data comes in two broad shapes. Wide data spreads values across many columns. Long data stacks them into a few tall columns instead. Notably, most analysis tools want the long shape. The infographic below shows the two side by side.
The wide table is easy for people to scan. However, a PivotTable struggles with month columns. The long table fixes that at once. As a result, one Value column feeds charts and pivots cleanly.
Unpivot Versus Pivot
These two commands are mirror images. Unpivot turns columns into rows, making data taller. Pivot turns rows into columns, making data wider. Therefore you pick the one that matches your goal.
Example 1: Unpivot Month Columns
Start with a classic wide table. It holds a Region column and twelve month columns. To make it tidy, you unpivot the months. Then each month becomes a row.
Example 2: Use Unpivot Other Columns
There are two unpivot choices, and one is safer. Unpivot Columns names the columns to fold. Unpivot Other Columns names the columns to keep instead. Because of this, new columns still get folded automatically.
Example 3: Pivot a Column Back to Wide
Sometimes you need the wide shape for a report. Pivot rebuilds columns from a category. You choose the column to spread and the values to fill. Then Power Query lays them out.
Example 4: Pivot Without Aggregating
Not every pivot needs a sum. Sometimes each pair already holds one value. In that case, aggregation would be wrong. Instead, you tell Power Query not to aggregate.
Example 5: Split a Merged Attribute
After unpivoting, one column may pack two facts. A label like Q1-East is a common example. Fortunately, you can split it into two columns. Then each part stands on its own.
Example 6: Reshape for a PivotTable
Here is the payoff of a good unpivot. A tidy table drives a flexible PivotTable. You can pivot by month, region, or both. Moreover, new data flows in on refresh.
Troubleshooting Reshaping
All three problems below are the most common. Each has a clear cause and a quick fix.
Unpivot folded the wrong columns
This usually means you selected the wrong set. Unpivot Columns folds exactly what you picked, so an extra column gets folded too. First, undo the step and start again. Then select only the columns you want to keep, such as Region. Next, right-click and choose Unpivot Other Columns. Because that command folds everything else, it also survives new columns later. As a result, your query keeps working next month without any edit.
Pivot returns an aggregation error
This appears when a pivot finds several values per cell. Power Query then needs a rule to combine them. First, decide whether the values should be summed or counted. If each pair is truly unique, choose Don't Aggregate instead. However, if duplicates exist, pick Sum or Count under Advanced options. Also check that you spread the right column, since the wrong one creates many collisions. With the right column and rule, the pivot completes cleanly.
New data breaks the query
Often a fresh file adds a column the query did not expect. A hard-coded Unpivot Columns step then misses it. To prevent this, always prefer Unpivot Other Columns. That command keeps your chosen columns and folds the rest. Therefore a new month or category joins automatically. Also avoid steps that name columns by position, because order can shift. Building on the keep columns makes the whole query far more robust.
Frequently Asked Questions
- What is the difference between pivot and unpivot?+Simply put, unpivot turns columns into rows, while pivot turns rows into columns. Unpivot makes data tall and tidy for analysis. Pivot makes it wide again for a readable summary. So you unpivot to analyse and pivot to present.
- Why should I unpivot before a PivotTable?+Because PivotTables prefer tall, tidy data. Month columns spread across the top confuse them. After an unpivot, one Value column feeds the pivot cleanly. As a result, you can group by any field with ease.
- Which unpivot option should I choose?+Generally, choose Unpivot Other Columns. You select the columns to keep, and Power Query folds the rest. Therefore a new column later folds in automatically. This keeps your query working with no edits.
- When do I pick Don't Aggregate?+Choose it when each pair already holds one value. In that case, summing would be wrong or throw an error. However, if duplicates exist, pick Sum or Count instead. So match the rule to your data.