
Someone emails you a CSV export from the company database every morning, and by lunchtime it is already out of date. Meanwhile the real data sits in SQL Server, current to the second, just out of reach. Power Query closes that gap. It connects Excel directly to SQL Server, pulls exactly the rows and columns you specify, and rebuilds the result on demand with a single Refresh. No more waiting for exports, no more stale CSVs, and no SQL expertise required to get started — though a little SQL knowledge unlocks a lot more power.
This guide covers the full connection process, the crucial difference between importing a whole table and writing a targeted query, how query folding keeps large pulls fast, and six practical patterns from a simple table load to parameter-driven reports.
What You Need Before Connecting
A SQL Server connection needs three pieces of information and one permission. Gather these before you start and the connection takes under a minute. Miss one and you will be stuck at the credentials screen. Your database administrator can supply all of them if you do not already know them.
Making the Connection — Step by Step
The connection wizard is short. Once you enter the server and choose how to authenticate, Power Query remembers the credentials so future refreshes are silent. These steps create the connection and open the Navigator, where you pick what to load.
Import a Whole Table vs Write a Query — Choose Wisely
This single decision shapes performance more than any other. Loading an entire table is easy but can drag millions of rows into Excel that you will never use. Writing a targeted query — or filtering in Power Query so the work pushes back to the server — returns only what you need. Understanding the trade-off up front prevents a slow, bloated workbook later.
Query Folding — Why Your Filters Should Push to the Server
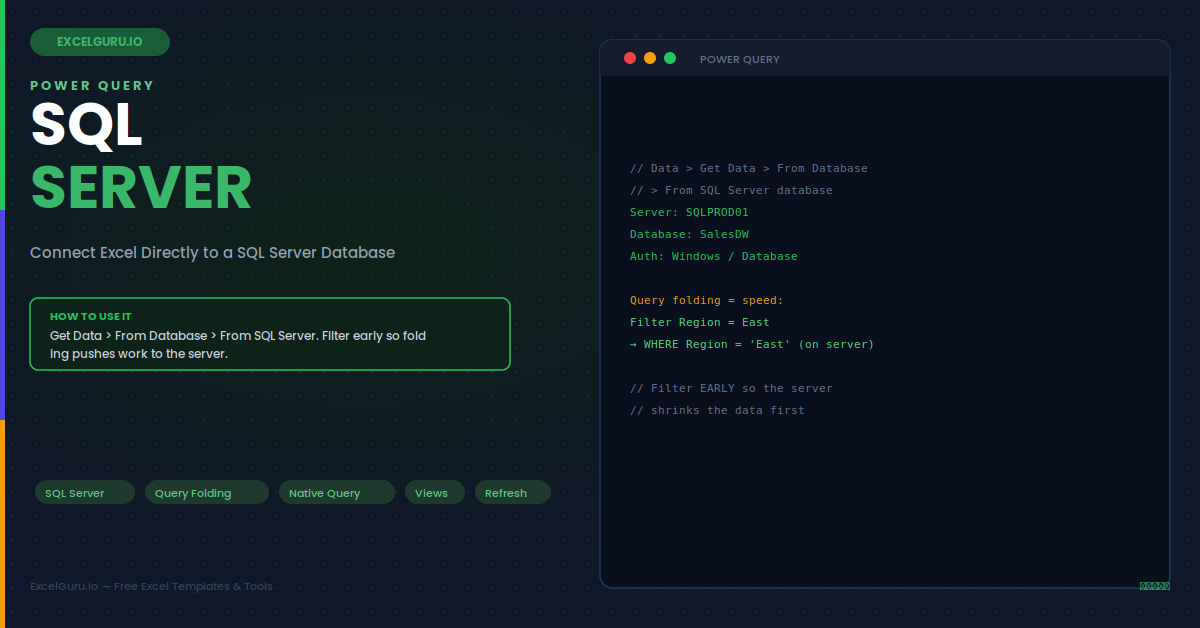
Query folding is the feature that makes Power Query on SQL Server fast. When your steps can be translated into a single SQL statement, Power Query sends that statement to the server and lets the database do the heavy lifting. The server returns only the final, filtered result. Break folding, and Excel is forced to download everything and process it locally — which is dramatically slower on large tables.
Example 1: Load a Single Table and Refresh Daily
The simplest useful pattern connects to one table or view and keeps it current. A "vSalesSummary" view built by your DBA is ideal — it already contains the right columns, so you load it and set it to refresh when the file opens. From then on, opening the workbook shows today's numbers with no manual export anywhere in the process.
Example 2: Filter to Last 90 Days So Folding Shrinks the Pull
A transactions table with millions of rows should never load in full for a recent-activity report. Adding a date filter that folds means SQL Server returns only the last 90 days. Specifically, the filter becomes a WHERE clause on the server, so the network only ever carries the rows you actually need rather than the entire history.
Example 3: A Native SQL Query with a JOIN Across Tables
When the data you need spans several tables, a native SQL query joins them on the server and returns a single tidy result. This is far more efficient than importing three tables and merging them in Excel. The join runs where the data lives, using the database's indexes, and only the combined output travels to your workbook.
Example 4: Parameter-Driven Reports — One Query, Many Regions
A report that should show one region at a time does not need a separate query per region. A Power Query parameter lets a single query switch its filter based on a value you control. Change the parameter from "East" to "West" and refresh, and the same query returns the other region. This turns one connection into a flexible, reusable report.
Example 5: Connect to a View Instead of Raw Tables
Database views are pre-built queries stored on the server, and they are often the cleanest thing to connect to. A DBA can create a view that joins tables, applies business rules, and exposes exactly the columns reporting needs. Connecting to the view rather than raw tables means the complex logic lives in one maintained place, and your Excel query stays simple and stable even when the underlying tables change.
Example 6: Combine SQL Data with a Local Excel List
Sometimes you need to enrich database data with something that only lives in a spreadsheet — a manual target list, a set of category labels, or a small mapping table. Merging a SQL query with a local Excel table does exactly this. Note that the merge itself runs locally in Excel and breaks folding, so filter the SQL side as much as possible before the merge to keep the database portion fast.
Troubleshooting SQL Server Connections
All three problems below are the most common connection issues. Each has a clear cause and a specific fix.
Cannot connect — the server is not found or times out
A "server not found" error usually means the server name is wrong or the machine cannot reach the database. First, double-check the exact server name with your DBA, including any instance name after a backslash or a port after a comma. Second, confirm you are on the corporate network or VPN, because most database servers are not reachable from outside. Third, a firewall may be blocking the connection port (1433 by default for SQL Server). If the name and network are correct but it still times out, ask your DBA whether your account is allowed to connect from your location.
The refresh is extremely slow or downloads far too much data
Slow refreshes almost always mean query folding broke early, forcing Excel to download the entire table and filter locally. Right-click each step and look for "View Native Query" — the last step where it is available is where folding stopped. Move your row filters and column removals before that point so they fold back to the server. Also avoid loading whole large tables when you only need a subset; add a WHERE-style filter or write a native query so the server returns just the rows you actually use in the report.
Power Query keeps asking for credentials on every refresh
Repeated credential prompts mean the saved connection credentials were not stored or have expired. Go to Data > Get Data > Data Source Settings, select the SQL Server entry, and click Edit Permissions to re-enter and save the credentials at the correct level (server or database). If your organisation uses a password that changes regularly, the stored database credentials will need updating after each change. For Windows authentication, ensure your domain account still has access, as a revoked permission also shows up as a repeated prompt.
Frequently Asked Questions
- How do I connect Excel to a SQL Server database with Power Query?+Go to Data > Get Data > From Database > From SQL Server database. Enter the server name and, optionally, the database name. Choose an authentication method — Windows for your domain account, or Database for a SQL username and password from your DBA — and click Connect. In the Navigator, tick the tables or views you want, then click Transform Data to shape them or Load to place them on a worksheet. You need at least SELECT permission on the objects you are reading, and you must be on the network or VPN that can reach the server.
- What is query folding and why does it matter?+Query folding is Power Query's ability to translate your steps into a single SQL statement that runs on the server rather than in Excel. When folding works, the database filters, removes columns, and aggregates before sending data back, so only the small final result travels over the network — making refreshes fast even on huge tables. Folding breaks when you add a step SQL cannot express, at which point Excel downloads everything and processes it locally. Keeping row filters and column removals early, while folding is still active, is the key to fast SQL queries.
- Should I import a whole table or write my own SQL query?+For most work, load the table and add filters in Power Query, letting folding push those filters to the server — this keeps the query maintainable and still fast. Write your own native SQL query when you need precise control, a join across several tables, or logic that is easier to express in SQL than in the Power Query interface. Avoid importing an entire multi-million-row table with no filter, because it produces a slow, heavy workbook. The goal either way is to return only the rows and columns your report actually uses.
- Does refreshing a Power Query connection change the database?+No. Power Query is strictly read-only when it pulls data — refreshing re-runs your SELECT-style query and updates the worksheet, but it never writes, updates, or deletes anything in SQL Server. This is why a read-only login is sufficient and recommended for reporting. Your edits inside Excel stay in the workbook and do not flow back to the database. If you need to send data back to SQL Server, that requires a separate tool or a purpose-built process, not a standard Power Query refresh.