Running multiple what-if analyses in Excel usually means copying sheets or manually changing input cells. Scenario Manager is built for this. It saves named sets of input values and lets you switch between them instantly. You can also generate a summary report that shows all scenarios side-by-side on a single sheet.
This guide covers how Scenario Manager works and six practical examples. These include a three-case business model, a loan comparison, a budget variance, a sales forecast, a pricing analysis, and a scenario summary report.
How Scenario Manager Works
Essentially, Scenario Manager stores named snapshots of specific input cells. Each scenario has a name (such as "Best Case") and a set of values for the designated changing cells. When you apply a scenario, Excel instantly replaces the current input values with the saved scenario values. All dependent formulas recalculate automatically based on the new inputs.
Examples 1–4: Scenario Manager in Practice
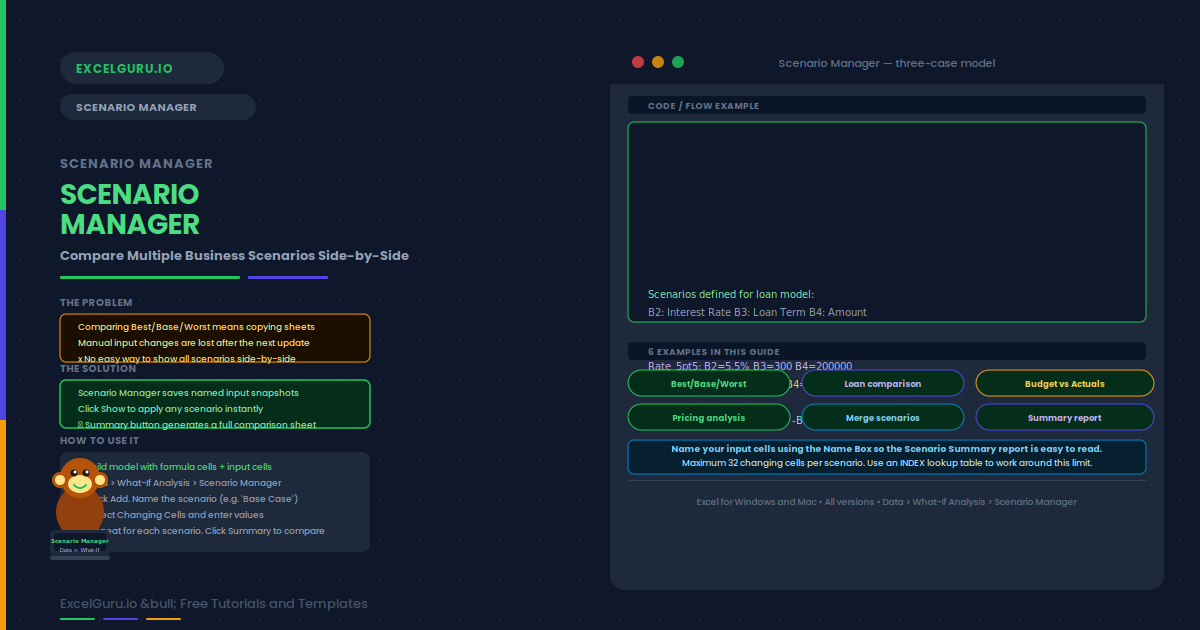
The most common use is a three-scenario financial model. The Base Case uses realistic assumptions. The Best Case uses optimistic inputs such as higher revenue growth and lower costs. The Worst Case uses conservative inputs. Specifically, create one scenario per case and use the Summary button to compare all three simultaneously.
A loan model uses PMT to calculate the monthly payment based on interest rate, loan term, and loan amount. Instead of changing cells manually, create one scenario per rate option. For example, create scenarios for 4%, 5.5%, and 7% interest. The Scenario Summary then shows the monthly payment and total cost for each rate side-by-side.
Save the original budget as a scenario before overwriting it with actuals. Later, save the actuals as a second scenario and a revised forecast as a third. Consequently, you can switch between the three views at any time and generate a comparison report without maintaining separate sheets for each version.
A pricing model has three input cells: selling price, unit cost, and expected volume. Create one scenario per pricing option — for instance, Premium, Standard, and Budget tiers. The Summary report shows revenue, gross margin, and profit for each tier side-by-side. This helps justify a pricing decision with clear data.
Examples 5–6: Merging Scenarios and Summary Report
Scenario Manager can merge scenarios from different workbooks. This is useful when team members each create scenarios independently in their own files. In the Scenario Manager dialog, click Merge and select the source workbook and sheet. The scenarios from that sheet are added to the current workbook without overwriting existing ones.
The Summary button generates a new sheet that displays all scenarios side-by-side. You specify which cells are the Result Cells — these are the formula outputs you want to compare. The summary sheet is static: it is a snapshot of the values at the time of generation. Consequently, if you add new scenarios later, you need to regenerate the report.
Common Issues and How to Fix Them
The Scenario Summary shows incorrect or blank result cells
Specifically, the result cells must be formula cells that depend on the changing cells. If a result cell is a hard-coded value rather than a formula, it will show the same number across all scenarios. Additionally, make sure the result cell references are correct before generating the summary — incorrect references will produce blank or wrong output.
Cannot add more than 32 changing cells to a scenario
Scenario Manager has a hard limit of 32 changing cells per scenario. If your model has more inputs than this, consider consolidating them. For example, group multiple inputs into a single lookup table and use INDEX to retrieve the right value based on a single scenario-selector cell. This reduces the number of changing cells significantly.
Frequently Asked Questions
-
What is Scenario Manager in Excel?+Scenario Manager is a what-if analysis tool found at Data > What-If Analysis > Scenario Manager. It saves named sets of input values and lets you switch between them instantly. All formula cells that depend on those inputs recalculate immediately when you apply a scenario. You can also generate a side-by-side Scenario Summary report comparing the results of all scenarios at once.
-
What is the difference between Scenario Manager and Data Table?+A Data Table shows results for a range of values along one or two input dimensions and displays all results simultaneously on the sheet. Scenario Manager, by contrast, saves complete named snapshots of multiple input cells and lets you apply each one to the model. Use Data Table when you want to see results for many values of one or two inputs. Use Scenario Manager when you have a specific set of named cases with multiple changing inputs each.
-
Can I protect scenarios so others cannot edit them?+Yes. When adding or editing a scenario, check the "Prevent changes" box in the Scenario dialog. Then protect the sheet with a password using Review > Protect Sheet. This prevents other users from modifying or deleting the saved scenarios. They can still apply scenarios and view the summary, but cannot change the saved input values.
-
How many scenarios can I create in Scenario Manager?+There is no documented limit on the number of scenarios you can create. However, each scenario is limited to a maximum of 32 changing cells. If your model needs more than 32 inputs to vary, consider restructuring the model to use a scenario-selector cell that drives a lookup table. This technique effectively removes the 32-cell limit by compressing multiple inputs into a single selection.