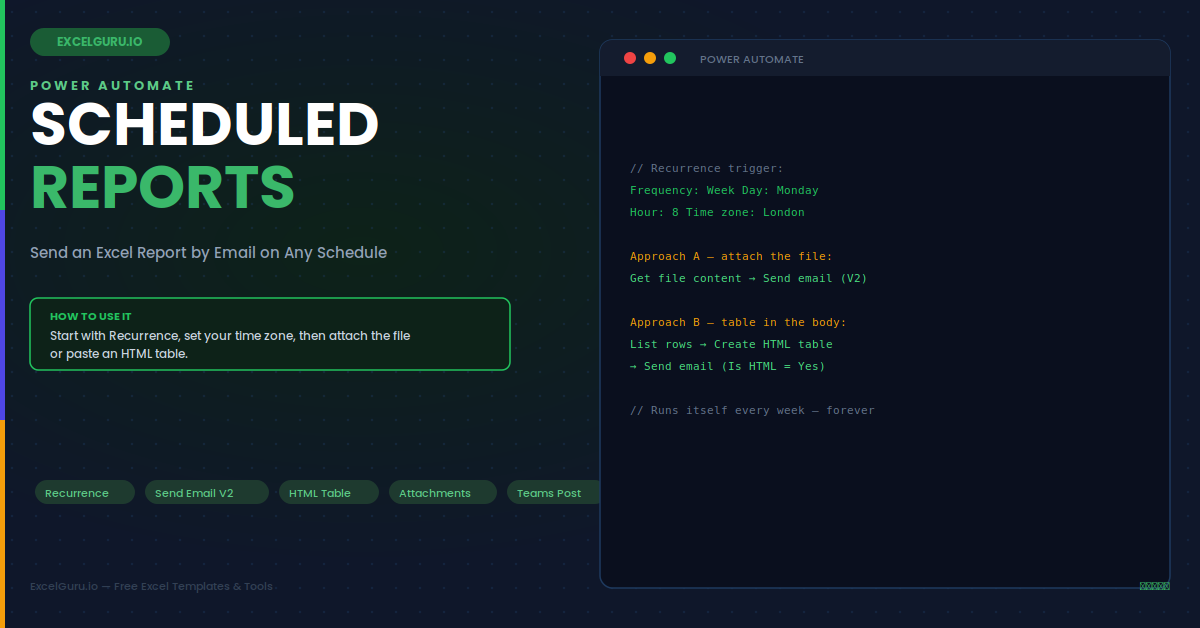
Automate recurring report distribution by scheduling Excel reports to be emailed automatically. This tutorial explains how to create a scheduled Power Automate flow, attach Excel workbooks or reports, configure Outlook email actions, define recipients, set delivery frequency, and monitor workflow execution. Ideal for analysts, managers, finance teams, HR professionals, and Microsoft 365 users who want to eliminate manual report sharing and ensure timely communication.
Every Monday at 8am the same ritual plays out in offices everywhere. Someone opens a spreadsheet, refreshes it, attaches it, writes a short email, and sends it to the same list of people. It takes ten minutes. It is easy to forget when you are on leave. And it is exactly the kind of predictable task a computer should own. Power Automate can send that Excel report on a fixed schedule while you are still asleep — weekly, daily, monthly, or on any pattern you define.
This guide covers two distinct approaches: attaching the whole workbook, and building a live summary table directly into the email body. It walks through the scheduled trigger in detail, six practical report scenarios, and the errors that most often break a scheduled flow.
Two Ways to Deliver an Excel Report by Email
Before building anything, decide which delivery style fits your audience. The two approaches solve different problems. Choosing the right one first saves rework later.
Approach A vs Approach B:
APPROACH A — Attach the workbook
Flow: Recurrence → Get file content → Send email with attachment
Best when: recipients need the full file to filter, pivot, or edit.
Trade-off: they must open an attachment to see anything.
APPROACH B — Build a summary table in the email body
Flow: Recurrence → List rows present in a table →
Create HTML table → Send email (table pasted in body)
Best when: recipients just want the numbers at a glance.
Trade-off: shows a snapshot, not the editable file.
Many teams use BOTH: a glanceable table in the body
for quick reading, plus the full workbook attached for anyone
who wants to dig in.
Match the format to the reader. Executives usually want Approach B — the key figures visible without opening anything. Analysts usually want Approach A — the raw file to slice themselves. When in doubt, do both in a single flow. The extra actions cost nothing and satisfy everyone.
The Recurrence Trigger — Scheduling in Detail
Both approaches start with the Recurrence trigger, which fires the flow on a fixed schedule instead of in response to an event. Its settings control not just how often the flow runs, but exactly which days and hours. This lets you avoid weekends, target a specific send time, and respect your local time zone.
Recurrence trigger settings:
Interval: 1
Frequency: Week
Advanced options (click "Show advanced options"):
Time zone: (GMT) Dublin, Edinburgh, Lisbon, London
On these days: Monday ← weekly Monday report
At these hours: 8 ← 08:00
At these minutes: 0 ← :00
Result: fires every Monday at 08:00 local time.
Other common patterns:
Daily 7am weekdays → Frequency Day, days Mon–Fri, hour 7
Month-end summary → Frequency Month, run 1st at 06:00,
then report on the PRIOR month's data
Twice daily → hours 9 and 17 on the same trigger
Example 1: Approach A — Attach the Weekly Sales Workbook
A regional sales workbook in SharePoint needs to reach five managers every Monday morning. This is the simplest reliable flow: schedule it, grab the file, attach it, send it. Three actions after the trigger, and the manual Monday ritual disappears for good.
1
Recurrence — every Monday at 08:00
Add the Recurrence trigger and set it to weekly, Monday, 08:00, in your time zone as shown above.
2
Get file content
Add "Get file content" (SharePoint) or "Get file content using path" (OneDrive). Point it at the exact workbook. This action loads the file's bytes so they can be attached.
3
Send an email (V2) with attachment
Add "Send an email (V2)" (Office 365 Outlook). Fill To, Subject, and Body, then open Advanced options to add an attachment.
Attachment fields in Send an email (V2):
To: managers@yourcompany.com (or a distribution list)
Subject: concat('Weekly Sales Report — ',
formatDateTime(utcNow(),'dd MMM yyyy'))
Body: Hi team, this week's sales workbook is attached.
Advanced options:
Attachments Name – 1: Weekly-Sales.xlsx
Attachments Content – 1: File Content ← from step 2's output
Done. Save, then use Test > Manually to fire it once immediately. The email lands with the workbook attached. From next Monday it sends itself.
Example 2: Approach B — A Live Summary Table in the Email Body
Managers who just want the headline numbers should not have to open an attachment. This flow reads the table, converts it to an HTML table, and drops it straight into the email body. The figures are then visible the instant the email is opened, even on a phone.
Approach B flow structure:
Recurrence (Monday 08:00)
│
▼
List rows present in a table ← Excel Online (Business)
File: Weekly-Sales.xlsx
Table: SalesSummary
│ returns every row as data
▼
Create HTML table ← Data Operation
From: value (output of List rows)
Columns: Automatic (or Custom to pick/rename columns)
│ returns a styled
string
▼
Send an email (V2)
Body: paste the "Output" of Create HTML table
into the body (switch body to code view first)
Result: the email opens showing a clean numbers table —
no attachment, no clicks, readable on mobile.
Style the bare HTML table. "Create HTML table" outputs an unstyled table. Wrap it in a little inline CSS in the email body — border-collapse, padding, a coloured header row. This makes it look professional rather than like a plain grid. A few lines of style turn a stark table into something that matches your brand.
Example 3: Report on Last Month, Not This One
A month-end report that runs on the 1st should summarise the month that just ended, not the empty new one. The trick is date arithmetic in the flow: subtract time from the run date to point at the correct period. Getting this right means the report label and the data window always agree, even across year boundaries.
Prior-month expressions (flow runs on the 1st):
Month just ended (name + year for the subject line):
formatDateTime(subtractFromTime(utcNow(),1,'Month'),'MMMM yyyy')
→ e.g. run on 1 Aug → "July 2025"
First day of last month (for a data filter):
startOfMonth(subtractFromTime(utcNow(),1,'Month'))
Last day of last month:
addDays(startOfMonth(utcNow()),-1)
Use these to filter "List rows present in a table" with an
OData filter, or to label the report accurately regardless of
which month the flow happens to run in.
Example 4: Refresh the Data Before Sending
A report is only useful if its numbers are current. If your workbook pulls from Power Query or an external source, you want it refreshed before the email goes out. There are two paths. You can trigger an Office Script that refreshes the workbook, or restructure so Power Automate pulls the live data itself. Choosing the right one depends on where the truth actually lives.
Two ways to guarantee fresh numbers:
OPTION 1 — Run an Office Script to refresh
Action: "Run script" (Excel Online Business)
The script calls calculate() and, for query-backed tables,
triggers a refresh. Place it BEFORE the read/attach step so
the email carries updated figures.
OPTION 2 — Pull the source data in the flow itself
Skip the workbook's own queries. Have the flow read directly
from the source (a SharePoint list, SQL, an API) and build the
report from that. The email is then always live by definition.
Rule of thumb: if the workbook is the source of truth, use Option 1.
If the workbook is just a viewer over other data, prefer Option 2.
Example 5: Send Each Manager Only Their Own Region
A single report to everyone is easy, but often each recipient should see only their slice. Looping over a list of regions and sending a filtered email per region turns one flow into a personalised distribution engine. Each manager receives a tidy report containing just their numbers. Nobody sees data that is not theirs.
Per-region personalised send:
List rows present in a table (full dataset)
│
▼
Apply to each region in [North, South, East, West]
│
├─ Filter array: keep rows where Region = current region
├─ Create HTML table from the filtered rows
└─ Send an email (V2)
To: lookup the manager's email for this region
Subject: concat(region,' Region — Weekly Report')
Body: the region-specific HTML table
Result: four emails, each private and relevant, from one flow run.
Example 6: Post the Report to a Teams Channel Too
Email is not the only destination. The same scheduled flow can post the summary into a Microsoft Teams channel, so the numbers appear where the team already works. Adding a "Post message in a chat or channel" action alongside the email means the report reaches people whether they live in their inbox or in Teams.
Add a Teams post to the schedule:
Action: "Post message in a chat or channel" — Microsoft Teams
Post as: Flow bot
Post in: Channel
Team: Sales
Channel: Weekly Reports
Message: a short summary + the HTML table (or a link to the file)
Placement: run it in parallel with, or right after, the email send.
Now the report reaches both the inbox and the Teams channel from a
single scheduled trigger — no duplicate effort.
Troubleshooting Scheduled Report Flows
All three issues below are the most common reasons a scheduled report fails or looks wrong. Each has a specific, quick fix.
The flow runs an hour early or late after the clocks change
This is a time zone problem. If you left the Recurrence trigger in UTC, it will not follow daylight saving changes in your region. As a result, the send time drifts by an hour twice a year. Open the trigger's advanced options and set the Time zone field explicitly to your local zone — for example, "(GMT) Dublin, Edinburgh, Lisbon, London". With a named time zone set, Power Automate adjusts automatically for daylight saving, and the report always arrives at the intended local time.
The attachment arrives empty or corrupt
An empty or unreadable attachment usually means the Attachments Content field was mapped to the wrong output. Confirm that the Attachments Content field uses the File Content output from the Get file content action, not the file metadata. Also verify the attachment name includes the correct extension, such as .xlsx, because a missing extension can make the file appear corrupt when opened. Finally, check that the source file actually exists at the specified path and that the connection has permission to read it.
The HTML table in the body shows raw code instead of a table
If recipients see angle brackets and tags instead of a formatted table, the email body was sent as plain text. In "Send an email (V2)", make sure the Is HTML setting is set to Yes. Then switch the body editor to code view and paste the Create HTML table output there. Sending as plain text causes the mail client to display the raw HTML markup literally. Enabling HTML rendering makes the table display as intended in every modern mail client.
Frequently Asked Questions
How do I schedule an Excel report to email automatically every week?+
Create an automated cloud flow starting with the Recurrence trigger set to weekly on your chosen day and time. Add "Get file content" pointing at your Excel workbook in SharePoint or OneDrive, then add "Send an email (V2)" from Office 365 Outlook. In the email action's advanced options, attach the workbook by mapping the file content output to the Attachments Content field. Save and test it once manually. From then on the flow runs on schedule and sends the report with no further action required from you.
Can I put the Excel data directly in the email instead of attaching a file?+
Yes. Use "List rows present in a table" to read the Excel Table, then "Create HTML table" (a Data Operation) to convert those rows into an HTML table string. Paste that output into the email body with the Is HTML option enabled. Recipients then see the numbers immediately when they open the email, with no attachment to open. This works best for summary figures; for large datasets that recipients need to filter or edit, attaching the full workbook remains the better choice.
Will the flow refresh my Power Query connections before sending?+
Not automatically. Power Automate reads the workbook as it was last saved, so if the data comes from Power Query it may be stale. To force a refresh, add a "Run script" action that executes an Office Script to recalculate and refresh the workbook before the read or attach step. Alternatively, restructure the flow to pull the source data directly — from a SharePoint list, SQL database, or API — so the report is always live and does not depend on the workbook's own refresh state.
Why did my scheduled flow stop running after a while?+
Power Automate automatically turns off flows that have not been triggered or have failed continuously for a long period, and it emails the owner before doing so. A flow can also stop if its connection credentials expire — for example after a password change — which shows as a connection error in the run history. Check the flow's run history for failures, re-authenticate any broken connections under the flow's connections list, and switch the flow back on if it was disabled. Setting up failure notifications helps you catch these issues before recipients notice a missing report.