
You want to chart a stock over the last year, or pull a month of closing prices into a model. In the past, that meant hunting on a finance website, copying a table, and pasting it in, then repeating the chore every update. Excel now does it with a single formula. The STOCKHISTORY function fetches historical price data for a stock, currency pair, or index, and spills it straight into your sheet. You give it a ticker and a date range, and it returns a dated table of prices that refreshes on demand.
This guide shows how to use STOCKHISTORY well, including its many optional settings. First, it covers the arguments and the important requirements. Then it walks through building price tables, choosing columns, and charting the result. Seven worked examples and a full troubleshooting section follow. By the end, you will pull live market history into a spreadsheet in seconds.
What STOCKHISTORY Does
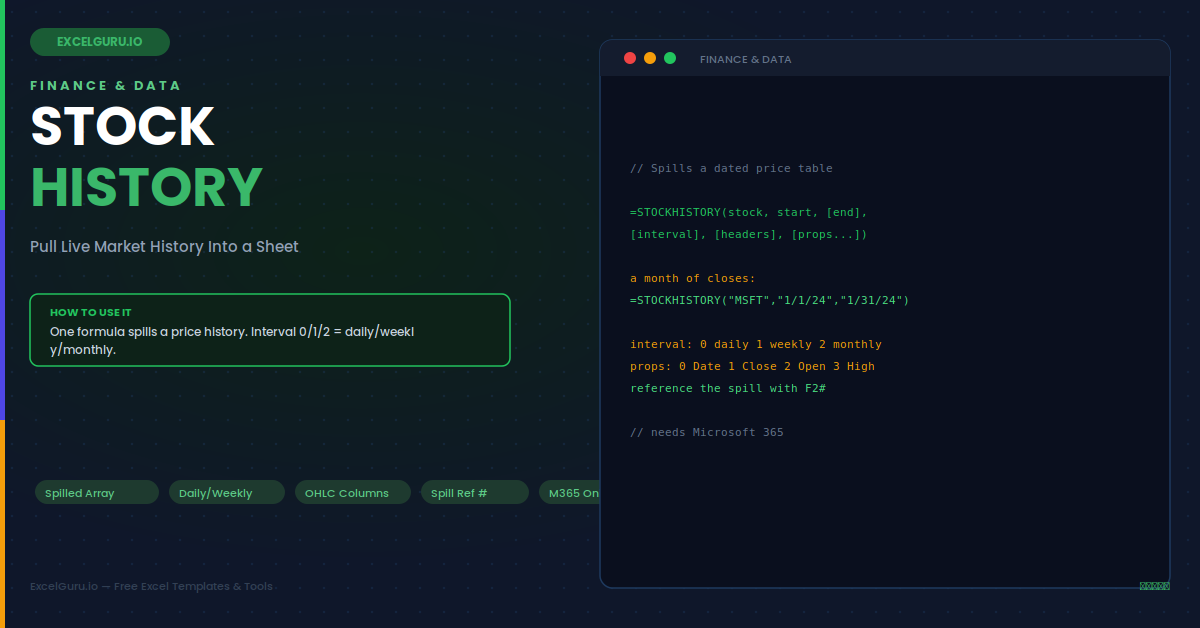
STOCKHISTORY returns past prices as a spilled array. You write one formula in a single cell. The results fill the cells below and beside it automatically. The infographic below shows this behaviour.
Because the output is a dynamic array, it grows to fit the data. A longer date range simply spills further down the sheet. However, the feature needs a Microsoft 365 subscription with the linked data types. Consequently, it is not available in older, standalone Excel versions. This is the single biggest thing to check before using it.
The Requirements
STOCKHISTORY is a modern, connected feature. It depends on a live data service online. A few conditions must be met before it works. These are all worth checking first.
The Syntax and Its Many Options
STOCKHISTORY has two required arguments and several optional ones. The first two are the ticker and the start date. The rest fine-tune the output. You add only the ones you need.
Example 1: A Basic Price History
Start with the simplest useful call. You give a ticker and a date range. STOCKHISTORY returns dates and closing prices. The table spills down on its own.
Example 2: Choose a Weekly or Monthly Interval
Daily data can be too detailed for some needs. The interval argument thins it out. You pass 1 for weekly or 2 for monthly. This suits longer-term trend views nicely. It also keeps a multi-year table manageable.
Example 3: Pick Specific Columns
You often want more than the close alone. The property arguments choose columns. Each number maps to a data field. You list them in the order you want them. The output columns follow that exact sequence.
Example 4: Control the Headers
Headers are helpful, but not always wanted. The headers argument controls them fully. You choose none, a simple row, or a labelled one. This matters most when feeding another formula. A stray text header can break a calculation.
Example 5: Reference the Spilled Result
The spilled array is easy to reuse elsewhere. You point at it with the spill operator. A hash sign after the top cell means the whole range. This keeps later formulas in perfect sync. They never drift out of date.
Example 6: Analyse the Data
A price history invites quick analysis at once. You can summarise the spilled prices directly. Common measures need only one formula each. The table below shows a few of them.
Each measure reads the spilled Close column by its spill reference. The results refresh whenever the data does. This turns a raw history into a live summary panel. You get a dashboard that maintains itself. No manual copying is ever required again.
Example 7: Guard a Missing Data Case
Sometimes a ticker or date returns nothing. A short guard handles that gracefully. You wrap the call to catch the error. This keeps a dashboard from breaking.
Troubleshooting STOCKHISTORY
All three problems below are the most common. Each has a clear cause and a quick fix.
The function name is not recognised
If Excel does not recognise STOCKHISTORY, your version likely does not support it. The function requires Microsoft 365, the subscription edition, and is not present in one-time-purchase versions like Excel 2019 or 2021. It also depends on the Stocks linked data type, which is only available in certain regions and languages. Check that you are running a current Microsoft 365 build and that linked data types are enabled for your account. If your edition or region does not support the feature, the function simply will not be available.
You get a #SPILL! error
This error means the result cannot spill into the cells it needs. STOCKHISTORY returns a whole table, so it requires empty space below and to the right of the formula cell. If any of those cells already contain data, the spill is blocked and you see #SPILL!. Clear the cells in the path of the output, or move the formula to an open area of the sheet. Once there is enough empty room for the full table to expand, the data spills correctly and the error disappears.
You get a #VALUE! or #BUSY error
If the function returns an error rather than data, check the ticker and the dates first. An unknown symbol, or a date range with no trading days, can return no data. Make sure the ticker is valid and, where needed, includes an exchange prefix. A temporary #BUSY or connection error can also appear while the service fetches data, especially with a slow connection. Wait a moment and let it retry, and confirm you are online. With a valid symbol, a sensible date range, and a working connection, the table returns as expected.
Frequently Asked Questions
- What does the STOCKHISTORY function do?+Essentially, STOCKHISTORY fetches historical price data for a stock, index, or currency pair and spills it into your worksheet as a dated table. You provide a ticker symbol and a start date, and optionally an end date, an interval, header settings, and which price columns to include. For example, =STOCKHISTORY("MSFT", "1/1/2024", "1/31/2024") returns dates and closing prices for that month. The output is a dynamic array that grows to fit the data and refreshes on demand. It replaces the old chore of copying tables from finance websites, and it requires a Microsoft 365 subscription with the Stocks linked data type available.
- Which columns can STOCKHISTORY return?+Specifically, you choose the columns using the property arguments at the end of the formula, each mapped to a number: 0 for Date, 1 for Close, 2 for Open, 3 for High, 4 for Low, and 5 for Volume. You list them in the order you want them to appear, so 0, 2, 3, 4, 1 produces a Date, Open, High, Low, Close table. If you omit the properties, the function defaults to Date and Close, which suits most simple charts. Selecting Open, High, Low, and Close together gives you a full OHLC dataset, which is exactly what you need for candlestick charts and detailed range analysis.
- Why do I get a #SPILL! error?+Because STOCKHISTORY returns an entire table as a dynamic array, it needs empty cells below and to the right of the formula to spill into. A #SPILL! error means something is blocking that path, usually existing data or formatting in the cells the output would occupy. To fix it, clear the cells in the way, or move the formula to an open part of the sheet with plenty of room. Remember that a longer date range or more columns needs more space. Once there is enough empty room for the full result to expand freely, the table spills correctly and the error goes away.
- Why is STOCKHISTORY missing from my Excel?+Notably, STOCKHISTORY is only available in Microsoft 365, the subscription version of Excel, and not in one-time-purchase editions such as Excel 2019 or 2021. It also relies on the Stocks linked data type, which Microsoft provides only in certain regions and languages, so availability varies by account. If the function is missing, first confirm you have a current Microsoft 365 subscription and that your app is fully updated. Then check that linked data types are enabled and supported for your region. If your edition or location does not offer the feature, the function will not appear, and you would need a supported Microsoft 365 setup to use it.