Variance and standard deviation measure the same thing — spread — but variance keeps the result in squared units while standard deviation takes the square root to return to the original scale. Excel provides two variance functions that mirror the same sample-versus-population distinction found in STDEV.S and STDEV.P. VAR.S calculates sample variance, dividing by n−1. VAR.P calculates population variance, dividing by n. Choosing the wrong one produces a biased result — too small for a sample analysis, or unnecessarily inflated for a complete population.
Variance itself is not always the final output. It is frequently an intermediate step in larger calculations — portfolio risk, ANOVA, regression coefficients, and statistical tests all rely on it. This guide covers the syntax, the population versus sample decision, and six practical examples including portfolio variance, weighted variance, and the relationship between VAR and STDEV.
What Is Variance?
Variance is the average of the squared differences between each data point and the mean. Squaring the differences serves two purposes. First, it removes negative signs so that values above and below the mean do not cancel each other out. Second, it amplifies large deviations more than small ones, making variance sensitive to outliers. Standard deviation is simply the square root of variance — it brings the result back to the original unit of measurement.
For example, if salary data has a variance of 25,000,000 (in squared pounds), the standard deviation is √25,000,000 = 5,000 (in pounds). Both measures describe the same spread. Variance is preferred in multi-step calculations because it avoids repeated square-root operations. Specifically, variances from independent components can be added together directly — standard deviations cannot.
What Is the Difference Between VAR.S and VAR.P?
The distinction is identical to the one between STDEV.S and STDEV.P. Use VAR.S when your data is a sample drawn from a larger population. Use VAR.P only when your data covers every member of the population with no exceptions. The n−1 denominator in VAR.S corrects for the tendency of sample data to underestimate the true population spread.
| Feature | VAR.S | VAR.P |
|---|---|---|
| Divides by | n−1 (Bessel’s correction) | n (total count) |
| Use when | Data is a sample from a larger population | Data IS the entire population |
| Legacy function | VAR (identical results) | VARP (identical results) |
| Relationship to STDEV | VAR.S = STDEV.S² | VAR.P = STDEV.P² |
| Matches | R var(), Python std(ddof=1)², Pandas var() | NumPy var() default (ddof=0) |
| Default choice | Yes — correct for most real-world datasets | Only when the dataset is truly complete |
What Is the Syntax for VAR.S and VAR.P?
| Argument | Required? | What it does |
|---|---|---|
| number1 | Required | The first number, cell reference, or range. Usually a column range like A2:A100. Text, logical values, and empty cells are ignored. Zeros are included. |
| number2, ... | Optional | Additional numbers or ranges, up to 255 arguments total. All values are pooled before variance is calculated. |
Examples 1–4: Core Variance Calculations
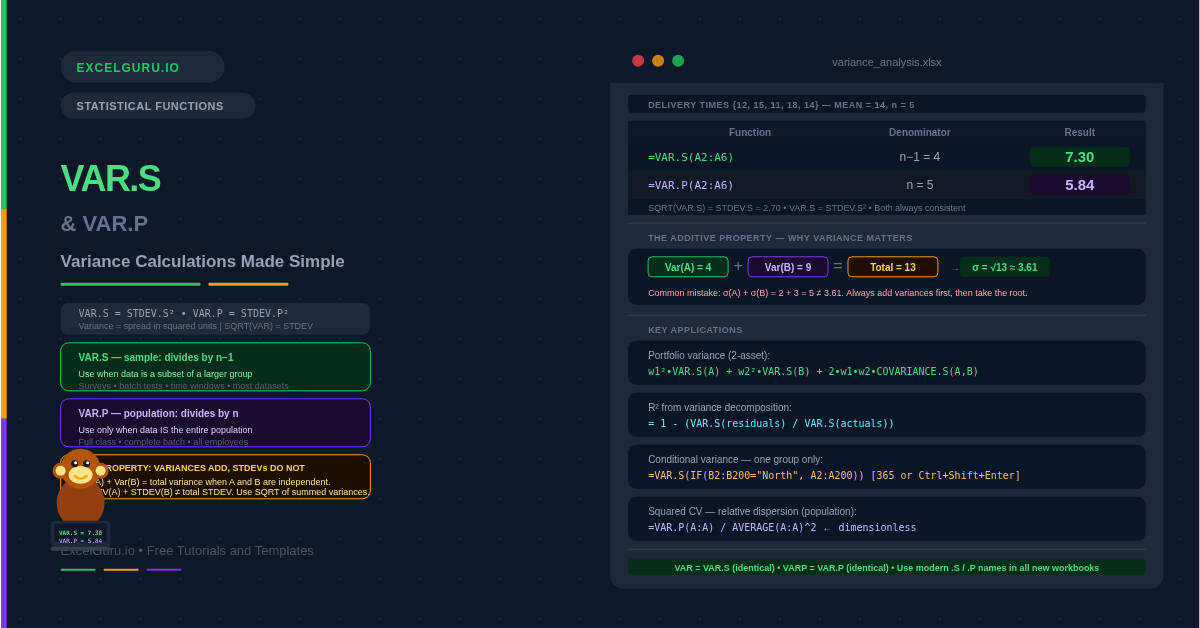
Running both functions on the same data makes the n versus n−1 difference immediately visible. The dataset below contains five delivery times. Notice that VAR.S is larger than VAR.P. Also notice that taking the square root of each variance returns the corresponding STDEV value — confirming that VAR and STDEV are always consistent with each other.
Portfolio risk in finance uses variance directly rather than standard deviation. This is because portfolio variance combines individual asset variances with a covariance term, and adding variances (not standard deviations) is mathematically valid. The COVARIANCE.S function works alongside VAR.S to build the full two-asset portfolio variance formula.
Comparing variance between groups is a fundamental operation in experimental analysis. The F-ratio in ANOVA is the variance between groups divided by the variance within groups. A high F-ratio indicates that group means differ more than random chance would predict. VAR.S is used throughout because the groups are samples from larger populations.
When every item in a production run is measured and recorded, the dataset is the full population. In this scenario VAR.P is correct because no sampling bias needs correcting. Quality engineers use population variance to define process limits and calculate capability indices. Additionally, the squared CV (coefficient of variation) uses variance to express spread as a proportion of the mean squared.
Examples 5 and 6: Applied Variance Analysis
Variance Decomposition and Conditional Analysis
Variance adds together in a way that standard deviation does not. This property makes it possible to decompose total variance into explainable and unexplainable components. In regression analysis the R² value is the ratio of explained variance to total variance. Calculating that ratio directly from VAR.S confirms the regression fit without needing the full regression output.
VAR.S and VAR.P do not support filtering natively. To calculate variance for a specific group — one region, one product, one department — combine them with IF in an array formula. In Excel 365, the formula enters normally. In Excel 2019 and earlier, press Ctrl+Shift+Enter to confirm it as an array formula.
Common Issues and How to Fix Them
VAR.S returns #DIV/0!
VAR.S requires at least two numeric values. With only one value, dividing by n−1 = 0 is undefined and returns #DIV/0!. This commonly happens when a conditional VAR.S(IF(...)) finds only one matching row, or when the range reference is incorrect and captures just one cell. VAR.P handles a single value without error — it returns zero — but statistically a variance of zero for one data point is meaningless. Add error handling with IFERROR to show a clear message: =IFERROR(VAR.S(A2:A100), "Insufficient data").
The variance result seems unexpectedly large
Variance is in squared units. A salary standard deviation of £5,000 produces a variance of 25,000,000 — which looks alarming until you remember the squaring. This is normal. If you need an interpretable measure of spread in the original unit, take the square root with SQRT or use STDEV.S directly. Variance is most useful as an intermediate value inside multi-step formulas, not as a reported statistic.
VAR gives a different result to what I expect from Python or R
Python’s NumPy np.var() divides by n (matching VAR.P) by default. Pandas df.var() divides by n−1 (matching VAR.S) by default. R’s var() also uses n−1, matching VAR.S. Consequently, if a NumPy result is smaller than Excel’s VAR.S, the two are using different denominators. Pass ddof=1 to NumPy to match VAR.S, or pass ddof=0 to match VAR.P.
Frequently Asked Questions
-
What is the difference between VAR.S and VAR.P?+VAR.S calculates sample variance by dividing by n−1. VAR.P calculates population variance by dividing by n. Use VAR.S when your data is a sample drawn from a larger group — a survey, a batch test, a time window. Use VAR.P only when your data covers every member of the population with nothing excluded. VAR.S is correct for most real-world datasets. On large datasets the two results converge, but VAR.S is still technically correct for a sample regardless of size.
-
What is the relationship between variance and standard deviation?+Standard deviation is the square root of variance. VAR.S = STDEV.S² and VAR.P = STDEV.P². The two measures describe the same spread but in different units. Variance is in squared units — for example, squared pounds or squared days. Standard deviation returns to the original units, making it more directly interpretable. Use variance when you need to combine or decompose spread across components. Use standard deviation when you need to interpret or communicate the spread in the original unit of measurement.
-
Is VAR the same as VAR.S?+Yes — VAR and VAR.S produce identical results. VAR is the legacy function from Excel versions before 2010. Microsoft introduced VAR.S and VAR.P to make the sample versus population distinction explicit. VAR remains available for backward compatibility but VAR.S is recommended for all new workbooks. Similarly, VARP and VAR.P are identical — always use VAR.P going forward.
More Questions About Variance
-
Why do variances add but standard deviations do not?+When two sources of variation are statistically independent, their variances add together: Var(A+B) = Var(A) + Var(B). This additive property does not hold for standard deviations. For example, if process step A has a standard deviation of 2 and step B has a standard deviation of 3, the total is not 2+3=5. Instead, total variance = 4+9=13 and total standard deviation = √13 ≈ 3.61. This is why engineers and statisticians work with variance when combining independent error sources.
-
How do I calculate variance for a specific group or category?+VAR.S and VAR.P do not filter natively. Wrap them in IF to select specific rows: =VAR.S(IF(B2:B200="North", A2:A200)). In Excel 365, this enters as a normal formula. In Excel 2019 and earlier, press Ctrl+Shift+Enter to confirm as an array formula. For two conditions, multiply the IF tests: =VAR.S(IF((B2:B200="North")*(C2:C200="Widget"), A2:A200)). Reference a cell instead of hardcoding the category label to make the formula dynamic.
-
When should I use variance instead of standard deviation?+Use variance when your calculation involves combining or comparing multiple sources of variation, such as portfolio risk (where asset variances and covariances add), ANOVA, regression R², or pooled variance in t-tests. In these contexts, variance is mathematically necessary because of its additive property. Use standard deviation when you need to interpret or report spread in the original unit of measurement — for example, "the average delivery time varies by 2.7 days" is clearer than "the variance is 7.3 days²."