LINEST fits a straight line. LOGEST fits an exponential curve. LINEST is the analytical backbone of linear regression. LOGEST is its counterpart for data that grows or decays by a constant percentage — compound revenue, viral adoption, bacterial growth, radioactive decay. Specifically, LOGEST returns the same rich statistics table as LINEST — growth factor, intercept, R², standard errors, F-statistic — but for the exponential model y = b × mₓ.
This guide covers the full LOGEST output, the relationship between LOGEST and GROWTH, and eight practical examples. You will learn how to extract the implied growth rate, compare exponential and linear fit, assess significance, fit multi-variable models, and transform data to verify fit visually. No statistical software is needed for any of these analyses.
What Does LOGEST Do?
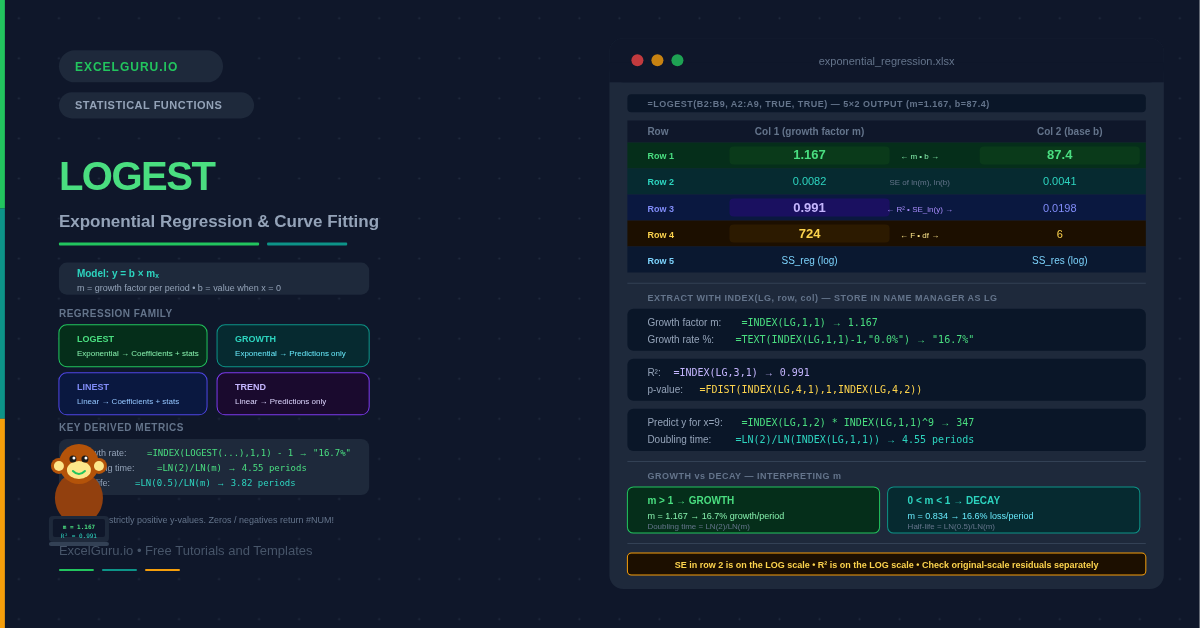
Specifically, LOGEST fits an exponential curve of the form y = b × mₓ to your data. The parameter b is the starting value when x = 0 (the y-intercept on the exponential curve). The parameter m is the growth factor — the multiplier applied each period. Internally, LOGEST first takes the natural logarithm of the y-values and then runs linear regression on ln(y) vs x. The result is mathematically equivalent to a direct exponential fit. Consequently, LOGEST inherits all of LINEST’s statistical machinery.
The output table also has the same 5-row structure as LINEST. Row 1 contains the model coefficients — m in column 1, b in column 2 for simple regression. Additionally, row 3 contains R² and the standard error. Furthermore, rows 4 and 5 contain the F-statistic, degrees of freedom, and sums of squares. Consequently, consequently, all the tools used to assess LINEST — F-tests, t-tests, confidence intervals — apply equally to LOGEST.
How Does LOGEST Relate to GROWTH, LINEST, and TREND?
Four functions share the same regression family in Excel. Understanding how they relate prevents the most common mistake: choosing the wrong function type.
| Function | Model type | Returns | Use when |
|---|---|---|---|
| LINEST | Linear: y = mx + b | Coefficients + full statistics | You need to analyse a linear model |
| TREND | Linear: y = mx + b | Predicted y-values only | You only need linear predictions |
| LOGEST | Exponential: y = b×mₓ | Coefficients + full statistics | You need to analyse an exponential model |
| GROWTH | Exponential: y = b×mₓ | Predicted y-values only | You only need exponential predictions |
What Is the LOGEST Syntax?
| Argument | Required? | What it does |
|---|---|---|
| known_y | Required | The dependent variable values. Must be strictly positive — zeros or negatives return #NUM! because LOGEST takes ln(y) internally. |
| known_x | Optional | The independent variable values. If omitted, Excel uses {1, 2, 3, ...}. Pass multiple columns for multi-variable exponential regression. |
| const | Optional | TRUE (default) = fit b normally. FALSE = force b = 1, fitting only the growth factor m. Use TRUE for almost all applications. |
| stats | Optional | TRUE = return the full 5-row statistics table. FALSE (default) = return only m and b. Always use TRUE for model assessment. |
What Does the LOGEST Output Table Contain?
The LOGEST output has the same shape as LINEST. It contains five rows by (k+1) columns, where k is the number of predictor variables. The key difference is in what row 1 contains. In LINEST, row 1 holds slopes and an intercept. In LOGEST, row 1 holds growth factors and the base value b. The R² in row 3 reflects the fit of the exponential model, not a linear one.
Examples 1–4: Core LOGEST Operations
The starting point is fitting the exponential model to historical data. LOGEST returns m and b from y = b × mₓ. R² then assesses how well the curve fits. Specifically, a growth factor above 1 means the series is growing. A factor below 1, however, means it is declining. Converting m to a percentage rate — (m − 1) × 100 — gives the implied compound growth rate per period.
Predictions from LOGEST apply the exponential formula y = b × mₓ with the fitted coefficients. The result matches GROWTH exactly. Both use the same underlying model. Store m and b in named cells. This avoids recalculating LOGEST for every prediction and keeps formulas readable.
Choosing between an exponential and linear model should be based on data, not assumption. Comparing R² from LOGEST against R² from LINEST on the same data tells you which model better describes the relationship. A higher R² indicates better fit. Additionally, plotting residuals from each model reveals patterns that a single R² may hide.
Similarly to LINEST, the F-statistic from LOGEST row 4 tests whether the exponential model explains significantly more variation than no model. A p-value below 0.05 confirms that the exponential relationship is statistically significant. The FDIST function converts F and degrees of freedom directly to a p-value.
Examples 5–8: Applied Exponential Regression
Decay, Multi-Variable Models, and Residual Diagnostics
LOGEST also handles exponential decay as naturally as growth. When m is between 0 and 1, the model describes a quantity that shrinks by a fixed percentage each period. For example, radioactive decay, product depreciation, and customer churn all follow this pattern. The half-life is a key metric derived directly from the LOGEST growth factor. It tells you how many periods until the value halves.
Similarly to LINEST, LOGEST supports multiple predictors by passing a multi-column known_x range. The model becomes y = b × m1ₓ¹ × m2ₓ², where each predictor has its own growth factor. The column order in the output reverses relative to the predictor columns — exactly as in LINEST. This is particularly useful when growth depends on several measurable factors simultaneously, such as time and marketing spend.
The best diagnostic is to plot ln(y) against x. If the relationship is truly exponential, the log data should scatter around a straight line. A curved pattern in the ln(y) vs x plot, however, means the exponential model is misspecified. Additionally, comparing the residuals of the exponential model against those of the linear model helps confirm which is more appropriate.
A complete exponential report extracts every statistic using a named range and INDEX. This approach is identical in structure to the LINEST dashboard from the LINEST article. Specifically, all statistics update automatically when the source data changes. Additionally, it includes the implied growth rate, doubling time, and a significance label — ready for management reporting without manual calculation.
Common Issues and How to Fix Them
#NUM! error from LOGEST
LOGEST returns #NUM! whenever any known_y value is zero or negative. The function takes ln(y) internally, and the natural log of zero or a negative number is undefined. First, check for zeros caused by missing entries and replace them with estimates or remove those rows. If negative values are genuine, LOGEST is not the right tool. Instead, shift the data or use LINEST. Instead, shift the data by a constant to make all values positive, or use LINEST on the untransformed data.
R² from LOGEST is high but predictions are inaccurate
LOGEST’s R² measures fit on the log-transformed data, not on the original scale. Consequently, a high log-space R² can still produce poor predictions in original units. Large values amplify small log-scale errors significantly. Always cross-check predictions by computing original-scale residuals (actual − fitted) alongside the log-scale R².
The growth factor m seems implausibly large or small
A factor very close to 1 (e.g. 1.002) means under 0.2% growth per period. In that case, a linear model may fit equally well. A factor far above 1 (for example, 3.5) implies tripling each period, which quickly becomes implausible for extended forecasts. In both cases, check whether the x-axis scale is appropriate. If x is in years but growth is monthly, the growth factor will be far from 1 and predictions misleading.
Frequently Asked Questions
-
What is the difference between LOGEST and GROWTH?+LOGEST and GROWTH fit the same exponential model (y = b × mₓ) to the same data and always produce identical predictions. The difference is in what they return. GROWTH returns predicted y-values for given x-values — it is a prediction tool. LOGEST returns the model coefficients (m and b) and, when stats = TRUE, a full table of regression statistics including R², standard errors, F-statistic, and sums of squares. Use GROWTH when you only need predictions. Use LOGEST when you need to understand, validate, or report on the model itself.
-
What is the relationship between LOGEST and LINEST?+LOGEST is equivalent to applying LINEST to the log-transformed data: LOGEST(y, x) produces the same R², F-statistic, and slope (as ln(m)) as LINEST(LN(y), x). The key difference is that LOGEST returns the actual growth factor m and base b — back-transformed from the log scale — rather than the log-scale slope. LINEST and TREND are the linear equivalents; LOGEST and GROWTH are the exponential equivalents. Choose based on whether your data follows a linear or percentage-rate growth pattern.
-
How do I find the compound growth rate from LOGEST?+The compound growth rate per period is the growth factor m minus 1. Extract m with =INDEX(LOGEST(B2:B9,A2:A9,TRUE,TRUE),1,1), then subtract 1 to get the rate as a decimal: m − 1. Format as a percentage to display it. For example, m = 1.167 gives a 16.7% compound growth rate per period. If your periods are months and you want an annual rate, raise the monthly growth factor to the power of 12: m¹² − 1. This converts the per-period rate to a per-year rate correctly through compounding.
More Questions About LOGEST
-
Can LOGEST handle negative or zero y-values?+No. LOGEST requires all known_y values to be strictly positive because it applies the natural logarithm internally. Zeros and negatives return #NUM!. If your data contains zeros, replace them with interpolated estimates or remove those rows. If the values are genuinely negative — for example, profit and loss figures — shift the entire dataset by a positive constant to make all values positive before running LOGEST, then remember to subtract the same constant from predictions. Alternatively, use LINEST on the untransformed data if a linear model is acceptable.
-
How do I use LOGEST in Excel 2019 and earlier?+In Excel 2019 and earlier, LOGEST is an array function. To return the full 5-row output, select a 5×2 range (or 5×(k+1) for multiple predictors), type the LOGEST formula, and confirm with Ctrl+Shift+Enter. Curly braces in the formula bar confirm array entry. If you only need one statistic — for example, the R² — wrap LOGEST in INDEX and enter in a single cell normally: =INDEX(LOGEST(B2:B9,A2:A9,TRUE,TRUE),3,1) does not require array entry.
-
What is the const argument in LOGEST?+The const argument controls whether the model fits the base b freely or forces it to 1. When const = TRUE (the default), LOGEST fits both b and m to best match the data. When const = FALSE, b is constrained to 1 and the model becomes y = mₓ. Use FALSE only when there is a theoretical reason for the curve to pass through the point (x=0, y=1) — for example, an index normalised to 1 at time zero. For almost all business, financial, and scientific applications, leave const as TRUE.