Your system says one thing; the shelf says another. That gap is normal, but ignoring it quietly drains profit.
This free stock reconciliation template closes the loop. You record both counts, and the sheet values every difference and asks why it happened.
Below, we cover the formulas, the workflow, and how to make the template fit your stockroom. You will also find realistic sample data already inside the file. Therefore, you can explore every formula, dropdown and chart first, and then replace the samples with your own records in minutes.
What Is a Stock Reconciliation Template?
A stock reconciliation template compares the quantity your system shows with the quantity you physically count. It then highlights the variance for each item.
Crucially, it puts a dollar value on that variance and records a reason. As a result, you can measure and reduce shrinkage over time.
Why Does Reconciliation Matter?
Inventory records drift from reality through miscounts, damage, theft and receiving errors. Left unchecked, that drift distorts both your accounts and your reorder decisions. Regular reconciliation catches the difference early and puts a dollar value on it. Therefore, you protect your margins and build a clear record of where losses occur. Over time, that record turns vague suspicion into hard evidence you can act on.
Why Use This Template?
Counting alone is not enough, because numbers without reasons change nothing. This template adds value because it:
- Values every variance in dollars, not just units.
- Separates shortages, overs and exact matches.
- Tracks the reason behind each difference.
- Calculates total shrinkage automatically.
- Shows where your losses concentrate.
What’s Inside the Template?
The workbook has four tabs:
- How to Use — a built-in guide. This will help you in using the template in a right way.
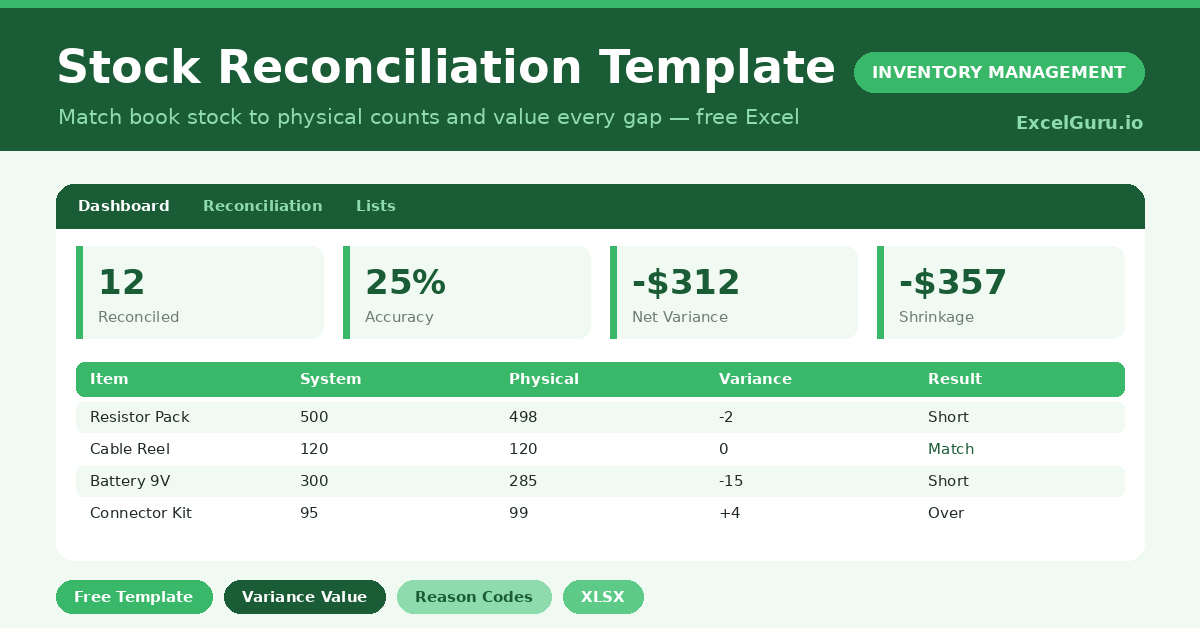
- Dashboard — accuracy, shrinkage and a reason chart. Gives you holistic insights.
- Reconciliation — the working sheet for both counts. Real working sheet.
- Lists — reason codes and the adjusted flag. helps in generating meaningful insights.
What Formulas Does the Template Use?
The calculations are straightforward Excel formulas:
| Formula | What it does |
| =Physical Qty – System Qty | Calculates the variance in units. |
| =Variance * Unit Cost | Values the variance in dollars. |
| =IF(Variance=0,”Match”,IF(<0,”Short”,”Over”)) | Classifies each result. |
| =SUMIF(Variance,”<0″,Variance Value) | Totals the shrinkage from shortages. |
| =SUMPRODUCT((Reason=x)*ABS(Value)) | Sums variance value by reason for the chart. |
How Do You Use the Template?
The workflow is simple. Just follow these steps:
- Open the Reconciliation tab and list the items you counted.
- Enter the unit cost and the system quantity.
- Enter the physical quantity you counted.
- Let variance, value and result calculate themselves.
- Pick a reason code for every non-match.
- Review shrinkage and accuracy on the Dashboard.
What Are the Best Use Cases?
The template fits many situations, such as:
- Month-end stock checks against accounting records.
- Post-audit reconciliation after a full count.
- Loss-prevention reviews in retail.
- Warehouse accuracy programs.
- Handover counts between shifts or sites.
How Can You Modify the Template?
You can tailor it freely. To change the reason codes, edit the Lists tab; the dropdown updates instantly. You can also add a location or counter column to slice variances further. Then add a matching summary on the dashboard. In addition, the sheet covers 40 items by default, and you can extend the formulas downward for larger counts.
What Mistakes Should You Avoid?
A few habits quietly undermine the template. Therefore, avoid these common mistakes:
- Skipping the reason code, which hides where losses come from.
- Reconciling weeks later, when the count is no longer trustworthy.
- Adjusting the system before confirming the physical count.
- Treating overs as harmless, since they often signal a counting error.
Tips to Get the Most From It
- Reconcile soon after counting, while memory is fresh.
- Be honest with reason codes, because the chart guides action.
- Track accuracy over months to prove improvement.
- Investigate large shortages first, since they hurt most.
Frequently Asked Questions
What counts as good reconciliation accuracy?
Many operations target 98 percent or higher. The template shows your live accuracy so you can set and chase a sensible goal.
How is shrinkage calculated?
Shrinkage is the total dollar value of negative variances, meaning items you have fewer of than expected. The dashboard sums these automatically.
Should I adjust my system after reconciling?
Yes, once you confirm the physical count. Mark the Adjusted column Yes so you know which corrections you have already posted.
Does it work in Google Sheets?
It does, with small tweaks. After importing, re-check the dropdowns and conditional formatting.
Can I reconcile by location or warehouse?
Yes. Add a location column to the Reconciliation sheet and a matching summary on the dashboard. Then you can compare accuracy across sites and focus your effort where shrinkage is highest.
Download the Template and Get Started
Shrinkage hides in the gap between your system and your shelf. This template drags it into the light and puts a price on it.
Download the Stock Reconciliation Template and value your next count today.