Order too late and you lose sales. Order too early and cash sits on the shelf. The reorder point sits exactly between those two mistakes. This free calculator finds that point for every item. You enter usage and lead-time figures, and the sheet returns the safety stock and reorder point at once. Below, we explain the formulas, the inputs, and how to tune the calculator for your own supply chain. You will also find realistic sample data already inside the file. Therefore, you can explore every formula, dropdown and chart first, and then replace the samples with your own records in minutes.
Also check out Inventory tracker excel template.
What Is a Reorder Point Calculator?
A reorder point calculator works out the stock level at which you should place a new order. It accounts for how fast you use an item and how long resupply takes.
It also adds safety stock, a small buffer for demand spikes and supplier delays. Together, these protect you from running out.
Why Does the Reorder Point Matter?
The reorder point is the heartbeat of good stock control. Set it too high and cash sits idle on the shelf. Set it too low and you face stockouts, rush orders and lost sales. A calculated point balances these risks for every item, using real usage and lead time. As a result, ordering becomes a simple, repeatable rule rather than a daily judgement call.
Why Use This Calculator?
Guesswork is expensive, and it scales badly across hundreds of items. This calculator removes it because it:
- Sets a data-driven reorder point per item.
- Sizes safety stock for demand and lead-time risk.
- Flags items you should order right now.
- Shows total shortfall units to plan a purchase.
- Works for hundreds of items in one sheet.
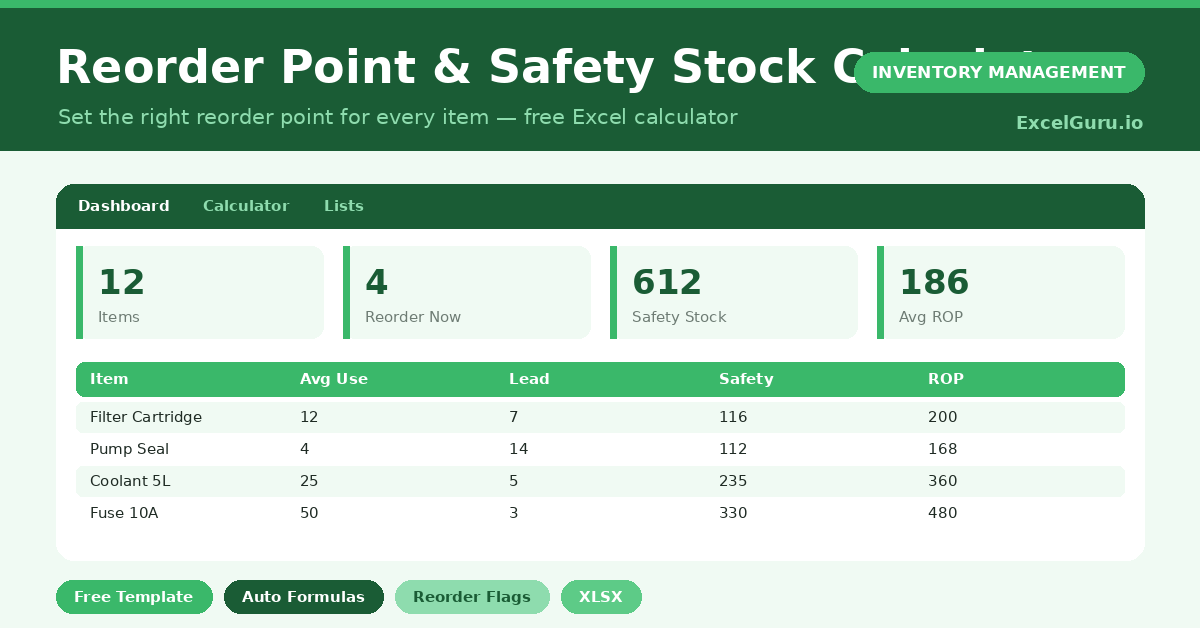
What’s Inside the Template?
The workbook has four tabs:
- How to Use — a built-in guide.
- Dashboard — reorder KPIs and a status chart.
- Calculator — the working sheet with all inputs and results.
- Lists — the formula reference notes.
What Formulas Does the Calculator Use?
The logic rests on two well-known formulas plus a flag:
| Formula | What it does |
| =(Max Daily x Max Lead) – (Avg Daily x Avg Lead) | Calculates safety stock from demand and lead-time variability. |
| =(Avg Daily x Avg Lead) + Safety Stock | Calculates the reorder point. |
| =IF(Current<=ROP,”YES”,”No”) | Flags whether you should reorder now. |
| =MAX(0, ROP – Current) | Shows the shortfall in units. |
| =COUNTIF(Reorder Now,”YES”) | Counts items needing an order today. |
How Do You Use the Calculator?
Using it is quick. Simply follow these steps:
- Open the Calculator tab and list your items.
- Enter average and maximum daily usage for each.
- Enter average and maximum lead time in days.
- Add the current quantity on hand.
- Read the safety stock, reorder point and reorder flag.
- Order the shortfall quantity for any item marked YES.
What Are the Best Use Cases?
The calculator fits many settings, such as:
- Maintenance teams stocking critical spares.
- Retailers managing fast-moving lines.
- Manufacturers planning raw-material buys.
- Service businesses holding consumables.
- Anyone moving from gut feel to real numbers.
How Can You Modify the Calculator?
You can shape it to your needs. To change the safety-stock method, edit the formula in the Safety Stock column; some teams prefer a service-level approach using standard deviation.
You can also add columns. For instance, insert an order quantity or supplier column, then reference it on the dashboard.
Moreover, the sheet handles 40 items by default, and you can copy the formula row down for more.
What Mistakes Should You Avoid?
A few habits quietly undermine the template. Therefore, avoid these common mistakes:
- Entering averages in the maximum columns, which erases the safety buffer.
- Using stale usage figures that no longer match real demand.
- Ignoring lead-time changes after switching suppliers.
- Ordering less than the shortfall, which leaves you below the point.
Tips to Get the Most From It
- Refresh usage figures monthly so the math stays accurate.
- Use real maximums, not averages, for the buffer to work.
- Reorder the full shortfall to return safely above the point.
- Review lead times after every late delivery.
Frequently Asked Questions
What is the difference between safety stock and reorder point?
Safety stock is a buffer for uncertainty. The reorder point is the trigger level that includes that buffer. In short, you order when stock hits the reorder point.
Which safety stock method does this use?
It uses the max-minus-average method, which needs no statistics. Therefore, it is easy to apply with the data most businesses already have.
Can I trust it for seasonal items?
Update the usage figures for the coming season first. The calculator is only as good as the demand numbers you feed it.
Does it suggest how much to order?
It shows the shortfall, which is the minimum to get back above the reorder point. You can add an economic order quantity column if you want a fuller answer.
Download the Template and Get Started
The reorder point turns stock control from guesswork into a simple rule. This calculator hands you that rule for every item.
Download the Reorder Point & Safety Stock Calculator and set smarter reorder levels today.