Two businesses with identical stock can report different inventory values. The reason is the costing method they choose, and the choice changes profit.
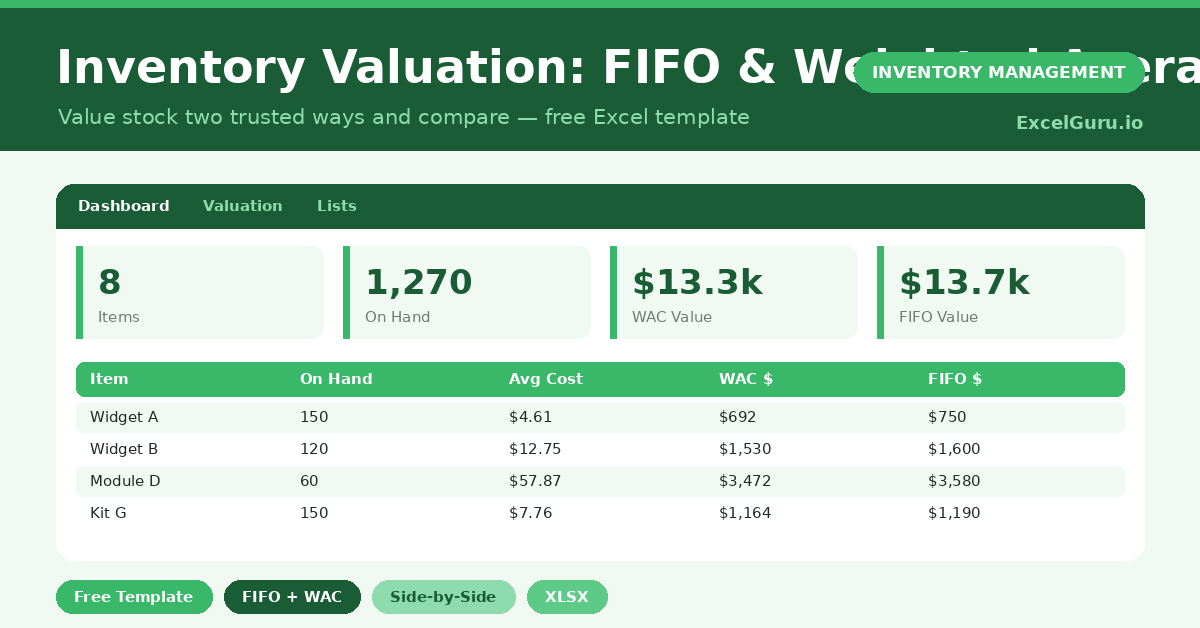
This free valuation template shows both common methods side by side. You enter your purchase lots, and the sheet values your stock under FIFO and weighted average. You will also find realistic sample data already inside the file. Therefore, you can explore every formula, dropdown and chart first, and then replace the samples with your own records in minutes.
Below, we explain the two methods, the formulas, and how to adapt the template to your own purchases.
What Is Inventory Valuation?
Inventory valuation puts a dollar figure on the stock you still hold. That figure flows straight into your balance sheet and your cost of goods sold.
Different methods assign costs differently when prices change. As a result, the method you pick affects both your reported profit and your tax.
Why Does the Costing Method Matter?
When purchase costs rise, FIFO and weighted average give different answers. FIFO leaves the newest, dearer costs in stock, while weighted average blends them.
That difference is not just academic. Therefore, it changes your reported margin and the value of your largest current asset. Seeing both numbers helps you choose a method and explain it with confidence.
Why Use This Template?
Seeing both methods at once removes guesswork. In particular, this one helps you:
- Value stock under FIFO and weighted average together.
- Compare the two figures instantly.
- Track multiple purchase lots per item.
- Calculate units on hand after sales.
- Support your accounts with clear workings.
What’s Inside the Template?
The workbook has four tabs:
- How to Use — a built-in guide.
- Dashboard — total value by method and the difference.
- Valuation — purchase lots and both valuations per item.
- Lists — the method reference notes.
What Formulas Does the Template Use?
The template uses clear Excel formulas:
| Formula | What it does |
| =SUM(Lot Quantities) | Calculates the total quantity purchased. |
| =Total Cost / Total Qty | Calculates the weighted average cost. |
| =Total Qty – Units Sold | Calculates the units still on hand. |
| =On Hand * Weighted Average Cost | Values stock under weighted average. |
| =Remaining lots x their costs | Values stock under FIFO, oldest sold first. |
How Do You Use the Template?
The valuation builds from a few inputs. Just follow these steps:
- Open the Valuation tab and list each item.
- Enter up to four purchase lots, oldest first.
- Record the quantity and cost for each lot.
- Enter the units sold so far.
- Let total quantity, average cost and on-hand units calculate.
- Compare the FIFO and weighted average values on the Dashboard.
What Are the Best Use Cases?
The template fits many situations, such as:
- Small businesses preparing year-end accounts.
- Retailers valuing stock for reporting.
- Importers tracking rising landed costs.
- Finance teams comparing costing methods.
- Owners explaining profit changes to an accountant.
How Can You Modify the Template?
You can tailor it freely. To track more lots, add lot columns and extend the formulas to include them.
You can also add a sales-value column to compare cost with revenue per item.
In addition, the sheet covers 20 items by default, and you can copy the formulas down for more.
What Mistakes Should You Avoid?
A few habits break the valuation. Therefore, avoid these common mistakes:
- Entering lots out of order, which corrupts FIFO.
- Selling more units than you purchased in the lots.
- Switching methods between periods without disclosure.
- Forgetting freight and duty in the lot cost.
Tips to Get the Most From It
- Always enter the oldest lot first for FIFO to work.
- Include landed costs so values reflect reality.
- Pick one method and apply it consistently.
- Review the FIFO-minus-weighted-average gap when prices move.
Frequently Asked Questions
What is the difference between FIFO and weighted average?
FIFO assumes the oldest stock sells first, so ending value reflects recent costs. Weighted average blends all costs into one rate. When prices rise, FIFO usually shows a higher inventory value.
Which method should I use?
That depends on your accounting rules and goals. The template shows both so you and your accountant can decide and apply one consistently.
Why must lots be entered oldest first?
FIFO consumes the oldest stock first. Therefore, the order of the lots determines which costs remain in your ending inventory.
Does it handle LIFO?
No. Many standards do not allow LIFO, so the template focuses on FIFO and weighted average. You can adapt the formulas if your rules permit LIFO.
Does it work in Google Sheets?
It does, with minor adjustments to formatting after importing.
Download the Template and Get Started
Your inventory value shapes your profit and your balance sheet. This template lets you see it clearly, two trusted ways. Download the Inventory Valuation Template and value your stock with confidence today.