
A production log is how a workshop or small manufacturer keeps output honest and on plan. A gut feeling that production “seems about right” is no substitute for knowing how each run measured against its target. So recording output run by run is the only reliable way to spot a slipping line before it becomes a missed order.
This free template records each run’s output against its target and works out the variance automatically. So it tracks your total output and your attainment against plan. As a result, you can see your performance clearly and act on any shortfall while there is still time.
What does the production log include?
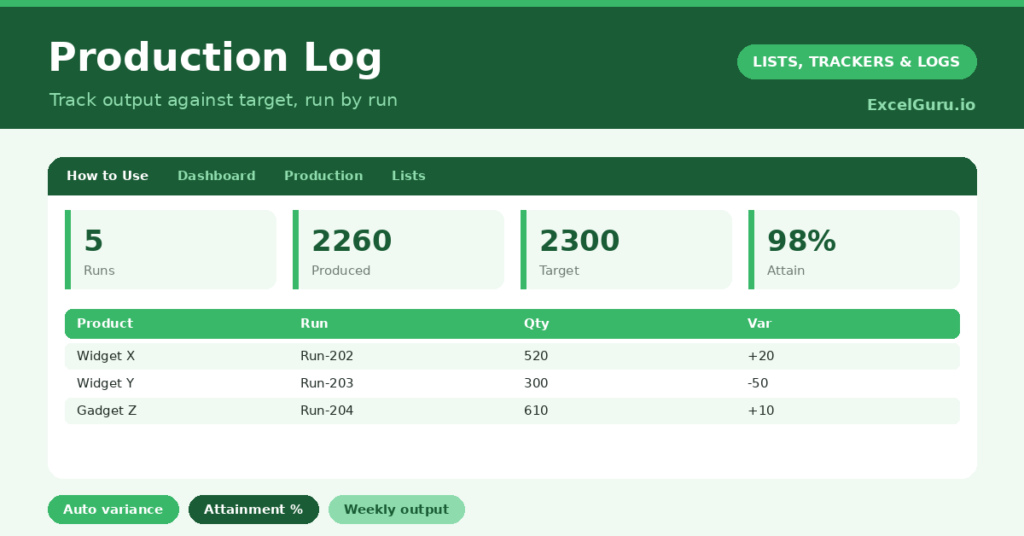
The template is one run log feeding a clear dashboard. A dropdown keeps operators or lines tidy. In short, you get the following:
- A production log with the date, product, batch or run, quantity produced, quantity target, an auto-calculated variance, operator and notes.
- An automatic variance showing how far each run was above or below target.
- A dropdown for the operator or line, so entries stay consistent.
- Colour-coding that flags any run that fell short of target.
- A dashboard showing total runs, total produced, total target, overall attainment, your best run and this week’s output.

Which formulas power the production log?
The variance is worked out for you. Each run’s variance is =Quantity Produced – Quantity Target, so a run of 480 against a target of 500 shows minus 20. A simple rule then highlights any negative variance, so shortfalls stand out.
On the dashboard, a SUM totals your output and another your target, while the overall attainment is =SUM(produced) / SUM(target). A MAX finds your best run, and a SUMPRODUCT totals this week’s output. So the log turns a series of runs into a clear measure of how production is performing against plan.
Why use a production log?
The first benefit is visibility. Without a record, a gradual decline in output can go unnoticed until it causes a problem. The log makes performance concrete, run by run. So you spot issues early.
The second benefit is diagnosis. By logging the product, the run and the operator, you can see where shortfalls cluster, whether a particular line, shift or product. The notes column captures the causes, such as downtime or material delays. Furthermore, the attainment figure gives a single, honest measure of how well production is meeting demand. In short, the log turns a gut feeling into actionable data.
What does the dashboard reveal?
The dashboard sums up production at a glance. The attainment figure is the headline, showing total output as a percentage of target, so you know instantly whether you are keeping up. So it is the number to watch.
The total-produced and total-target figures give the underlying scale, and this week’s output shows recent performance. The best-run figure marks what is achievable on a good day. Because it all updates as you log runs, the trend stays current and any decline is visible. So the dashboard keeps production firmly on plan.
How do you use it?
Record each run as it completes, entering the quantity produced and the target. So the variance and attainment calculate immediately. Use the notes column to capture anything that affected output, such as a machine fault.
Review the dashboard regularly, watching attainment and any runs flagged below target. When a run falls short, investigate the cause before the next one. Because every run feeds the trend, you can tell whether a fix actually worked. In short, the log turns recording output into a tool for steady, measurable improvement.
How do you customise it?
Edit the operators or lines and sample products on the Lists tab to match your operation. Additionally, you can add columns for the shift, the downtime in minutes, or a scrap count. A column for the run’s start and end time helps you track throughput. The template adapts to a small workshop or a multi-line production floor.
What mistakes should you avoid?
The first mistake is logging only the output and skipping the target, which makes the variance and attainment meaningless. So always record both. The second mistake is recording a shortfall but never noting why.
The notes are where the lessons live, so capture the cause of every miss. Finally, do not log runs inconsistently. Attainment only tells a true story if you record every run, so keep the log complete. A reliable record is what makes the trend worth trusting.
Frequently asked questions
How does the production log calculate attainment?
It divides your total output by your total target across all runs, giving a single percentage. So you can see at a glance whether production overall is keeping up with the plan.
Can it show which line or operator underperforms?
Yes. Each run records its operator or line, so you can filter and compare. Combined with the variance column, that reveals where shortfalls tend to cluster.
What does a negative variance mean?
It means a run produced fewer units than its target, and the log highlights it. The notes column is then the place to record why, so you can address the cause before the next run.
Record each run’s output and target, let the variance and attainment calculate, and act on any shortfall. The dashboard then keeps performance against plan in clear view. A production log turns a vague sense of how things are going into a precise, run-by-run measure you can actually manage and improve.