
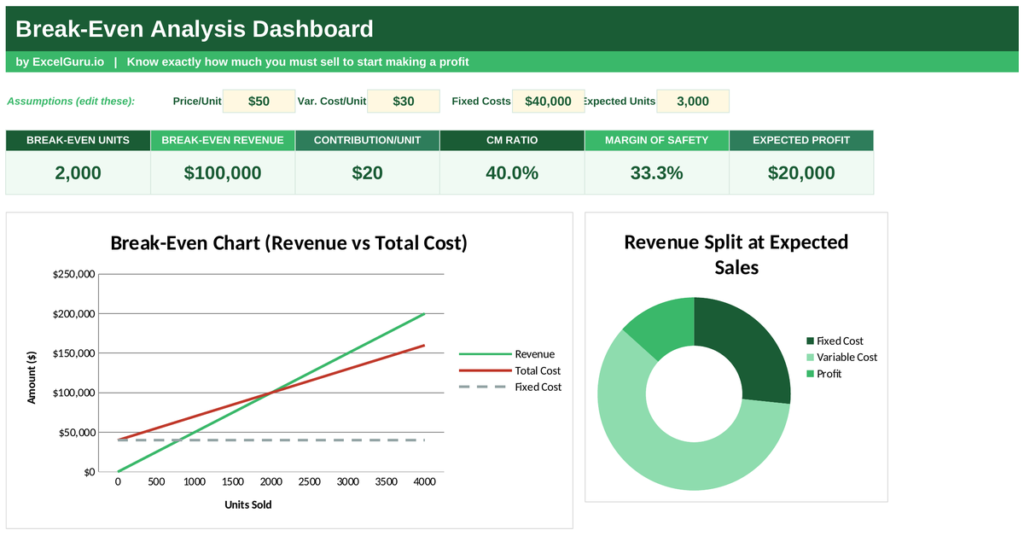
Before you launch a product or set a price, one question matters more than any other: how much must you sell just to stop losing money? Break-even analysis answers it exactly. This free Excel template finds the point where your sales cover every cost, shows the formula behind it, and reveals how much cushion you have before a loss. Below you will learn what break-even means, the precise formula, and how the template works out each figure.
What is break-even analysis?
Break-even analysis finds the sales level where total revenue equals total cost, so profit is exactly zero. Sell one unit more and you make a profit. Sell one unit less and you take a loss.
The idea rests on splitting costs into two kinds. Fixed costs, such as rent and salaries, stay the same no matter how much you sell. Variable costs, such as materials and packaging, rise with every unit you make. Because fixed costs must be paid whatever happens, you need enough sales to cover them before any profit appears. So the break-even point marks the exact moment your business stops running at a loss.
The break-even analysis formula
The whole method turns on one idea: contribution margin. Each unit you sell contributes something toward your fixed costs, and once those are covered, the rest is profit.
Contribution margin per unit = Selling price − Variable cost per unit
Break-even point (units) = Fixed costs ÷ Contribution margin per unit
So you first work out the contribution margin, the price of a unit minus the cost of making it. Then you divide your fixed costs by that margin to find how many units you must sell. To express it in money, you multiply the break-even units by the price, or divide fixed costs by the contribution margin ratio, which is the margin divided by the price.
One more figure matters: the margin of safety. It shows how far sales can fall before you hit break-even, calculated as actual sales minus break-even sales, divided by actual sales. So a wide margin of safety means a comfortable cushion, while a thin one signals risk.
How the template runs the break-even analysis
The template asks for just four inputs: your selling price, your variable cost per unit, your fixed costs and your expected sales. From those, every result flows through clear formulas you can inspect.
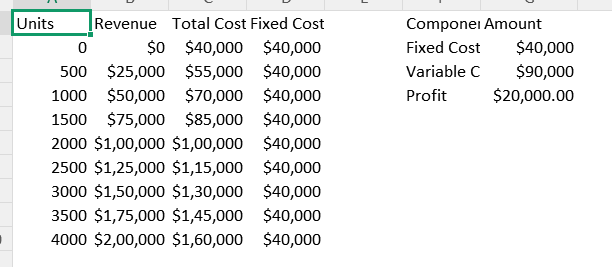
Contribution margin appears as =D5-F5, the price minus the variable cost. The break-even point in units uses =H5/(D5-F5), dividing fixed costs by that margin. Break-even revenue follows as =(H5/(D5-F5))*D5, the break-even units times the price. The contribution margin ratio uses =(D5-F5)/D5. The margin of safety uses =(J5-H5/(D5-F5))/J5, and the profit at your expected volume uses =J5*(D5-F5)-H5. So change any input and the whole analysis updates at once.
A worked break-even example
Put real numbers in and the maths becomes clear. Say you sell a product for 50, it costs 30 to make, your fixed costs are 40,000, and you expect to sell 3,000 units.
Your contribution margin is 50 minus 30, which is 20 per unit. Your break-even point is 40,000 divided by 20, which is 2,000 units. In money, that is 2,000 times 50, or 100,000 in revenue. Because you expect 3,000 units, your margin of safety is (3,000 − 2,000) ÷ 3,000, or 33.3%. At that volume your profit is 3,000 times 20 minus 40,000, which is 20,000. So you can afford a third of your sales to disappear before you slip into a loss.
Reading the chart
The dashboard plots revenue and total cost as two lines against units sold. The revenue line climbs from zero, while the total cost line starts at your fixed costs and rises more slowly.
Where the two lines cross is your break-even point. To the left of it, cost sits above revenue, so you make a loss. To the right, revenue pulls ahead, so you turn a profit. Because the crossing point is so visual, anyone can grasp the result in seconds. So the chart turns a formula into a picture your whole team understands.
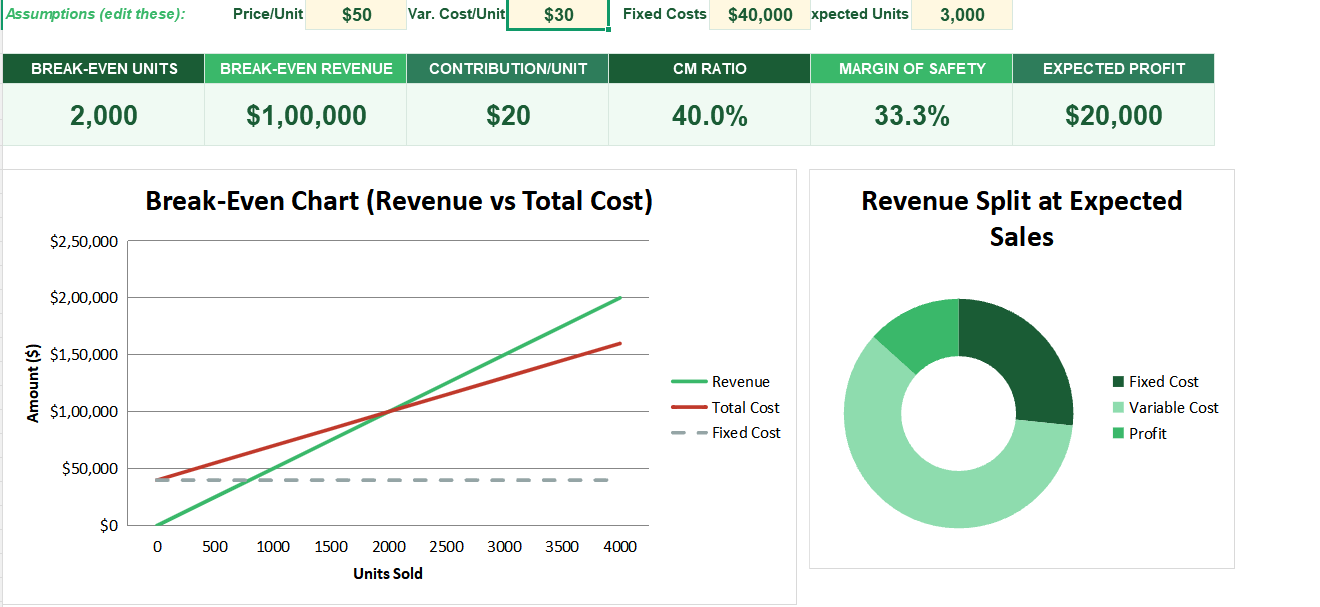
Lower your break-even point by cutting fixed costs or widening your contribution margin. Even a small price rise moves the break-even point closer and grows your safety cushion.
Who uses break-even analysis
Business owners use it to test whether a product or venture can pay its way. It tells them the exact sales target to aim for.
Start-up founders use it to model pricing and cost decisions before they commit. Finance teams use it to assess risk and set targets. Product managers use it to judge a launch. Because every business has costs to cover, the analysis suits almost any venture.
Making the template your own
The template is a starting point, not a fixed form. You can change the inputs to model different prices and cost structures. You can compare scenarios side by side.
The dashboard bends to your needs, so you can add a target-profit line to see the sales needed for a specific profit, not just break-even. A quick edit does it. You might also test how a price change shifts the break-even point. The structure welcomes that kind of extension without complaint.
Knowing your break-even point turns pricing from a guess into a decision. Break-even analysis shows exactly how much you must sell, how much cushion you hold, and how a change in cost or price moves the line. So download the template, enter your four numbers, and see the sales target that keeps your business in the black.