
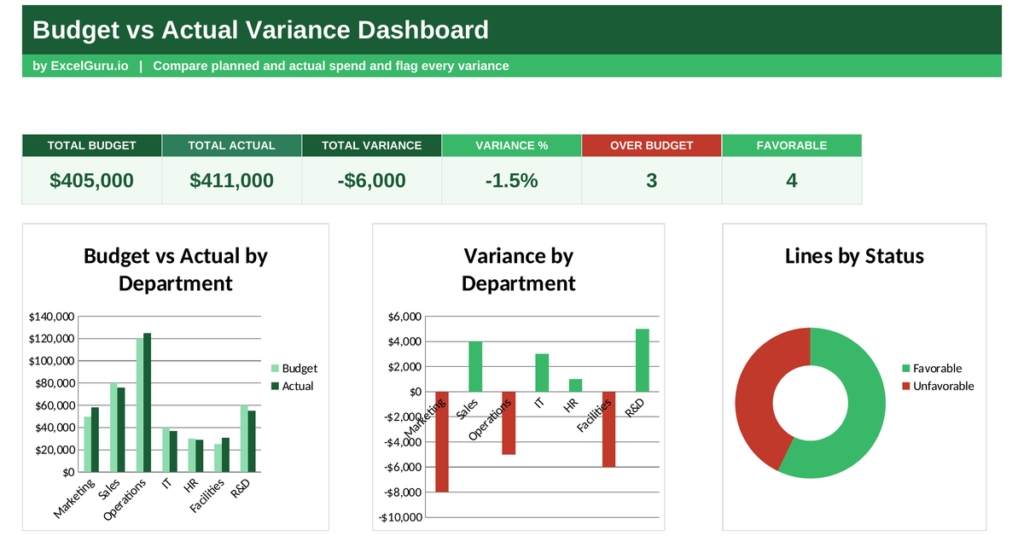
A budget is a plan, but reality rarely follows the plan exactly. The gap between the two is where money is quietly won or lost. A budget vs actual report measures that gap, comparing what you planned to spend with what you actually spent. This free Excel template calculates the variance for every line, flags overspending, and shows where you came in under. Below you will learn what variance analysis is, the formula behind it, and how the template calculates each figure.
Also, check out Breakeven Analysis Dashboard Template in Excel.
What is budget vs actual analysis?
Budget vs actual analysis compares your planned figures with your real results. It measures the variance, the difference between the two, for every line.
A favourable variance means you spent less than planned, while an unfavourable one means you overspent. Comparing plan with reality is how businesses keep spending under control and learn to budget better. Because a budget nobody checks is just a wish, the comparison is what gives it teeth. So budget vs actual analysis turns a static plan into a living control tool.
Why variance analysis matters
Setting a budget is easy; sticking to it is hard. Without a comparison, overspending hides until the money is gone.
Variance analysis catches it early, line by line, so you can act while there is still time. It also shows which areas consistently miss their budget, revealing where your planning needs work. Because control depends on comparison, this analysis is the heart of good budgeting. So it protects both this month’s spending and next year’s plan.
The variance formula
The whole report rests on a single subtraction, repeated for every line. It compares budget with actual.
Variance = Budget − Actual (positive is favourable, negative is over budget)
Variance % = Variance ÷ Budget
Status: Favourable if variance ≥ 0, otherwise Unfavourable
So variance subtracts actual spend from the budget. A positive result means you spent less than planned, which is favourable, while a negative result means you overspent. Dividing the variance by the budget gives a percentage, showing how big the gap is relative to the plan. A status flag then labels each line favourable or unfavourable. So one subtraction drives the entire report.
How the template calculates budget vs actual
The template needs each line’s budget and actual figures. From there it works out every variance for you.
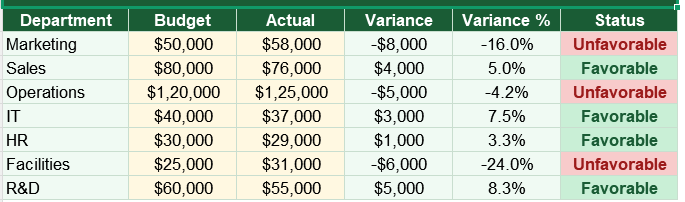
Variance appears as =B3-C3, the budget minus the actual. The variance percentage uses =(B3-C3)/B3, that gap over the budget. The status uses =IF(B3-C3>=0,”Favorable”,”Unfavorable”). The dashboard then totals budget and actual with SUM, and counts the favourable and unfavourable lines with COUNTIF. So every figure updates the moment you enter a new actual.
A worked variance example as per the above image
Take one line and the maths is clear. Suppose marketing had a budget of 50,000 but actually spent 58,000.
The variance is 50,000 minus 58,000, which is a negative 8,000. Because the result is negative, the line is unfavourable, meaning it overspent. The variance percentage is minus 8,000 over 50,000, or minus 16%. So the report flags marketing as over budget and shows exactly how far, in both money and percentage.
Reading the charts and visualization
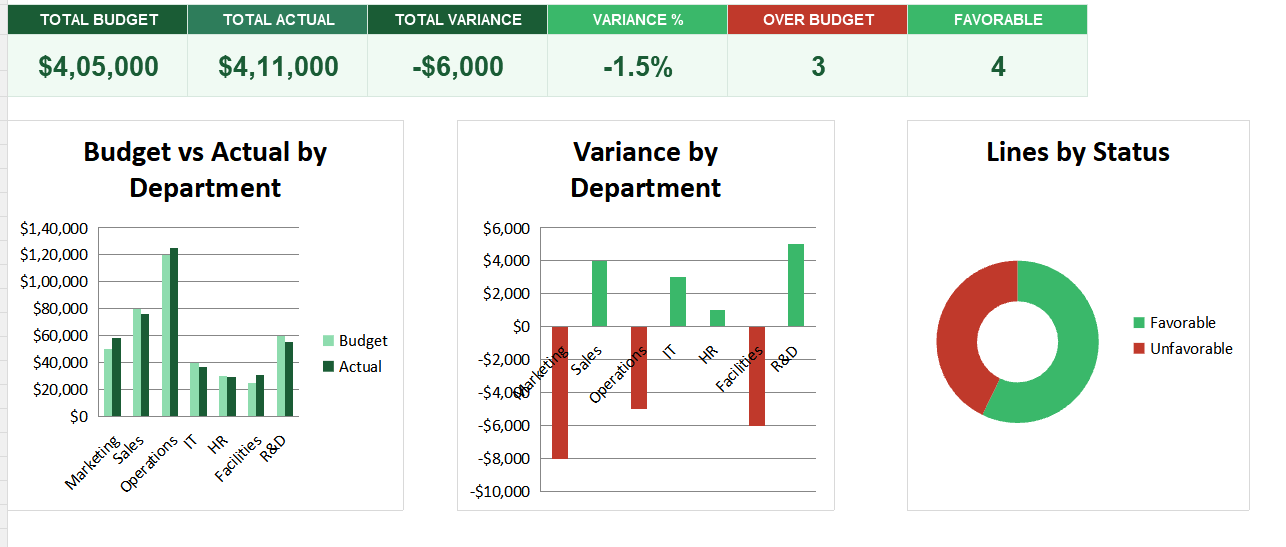
The first chart compares budget with actual for each department, so overspending stands out at once. The second chart shows the variance by department, with favourable and unfavourable lines clearly separated.
A tall negative bar is an instant warning of a department running over. The third chart is a doughnut splitting lines into favourable and unfavourable. Because you see the comparison and the status together, problem areas are obvious. So together the charts turn a budget review into a clear list of what to fix.
Chase the biggest unfavourable variances first. A department far over budget usually offers more savings than several lines that are only slightly off.
Who uses budget vs actual analysis
Finance teams use it to control spending across the business. It shows them where budgets are slipping.
Department heads use it to manage their own budgets. Business owners use it to keep costs in check. Project managers use it to track spend against plan. Because every budget needs checking against reality, the report suits many settings.
Making the template your own
The template is a starting point, not a fixed form. You can add lines for every department or cost category. You can extend it across several months.
The dashboard bends to your needs, so you can add a forecast column alongside budget and actual. A quick edit does it. You might also flag any variance beyond a set threshold. The structure welcomes that kind of extension without complaint.
A budget only works when you check it against reality. A budget vs actual report measures the gap on every line, flags overspending, and shows where you came in under. So download the template, enter your figures, and turn your budget from a plan into a tool that controls spending.
Budgets rarely fail all at once. They drift, a little at a time, until the gap is large.
A small overspend here and an optimistic forecast there add up quietly across a year. Regular variance checks catch that drift early, while it is still cheap to correct. So the point of the report is not to assign blame but to keep the plan and reality close together. Because a budget reviewed monthly stays useful, while one filed away becomes fiction.