
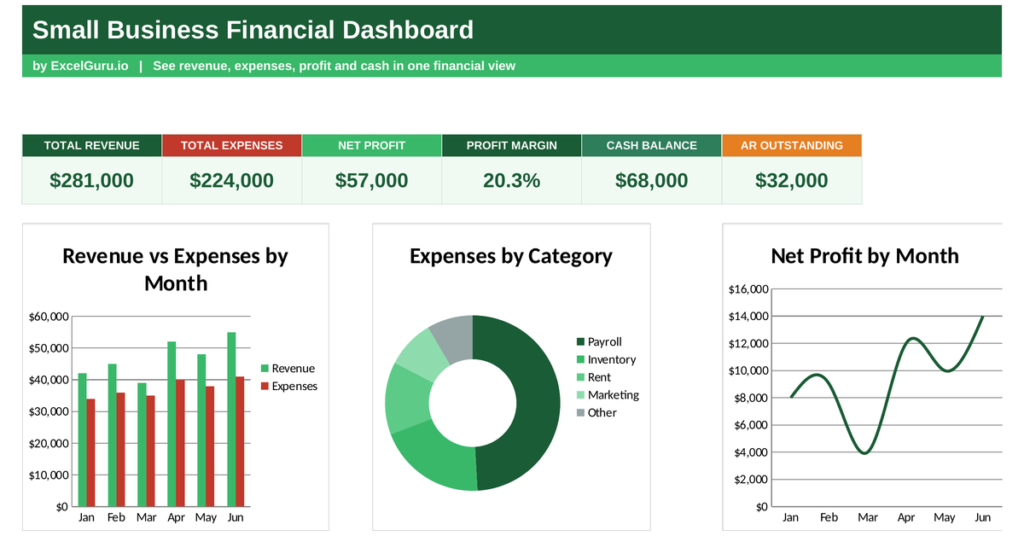
Running a small business often means flying by feel, with the real financial picture buried in a bank app and a shoebox of receipts. A small business dashboard replaces that guesswork with clarity, showing revenue, expenses and profit in one place. This free Excel template tracks your money month by month, calculates your profit and margin, and reveals where your costs go. Below you will learn what the dashboard tracks, the formulas behind it, and how the template works each one out.
What is a small business dashboard?
A small business dashboard is a single view of your financial health. It brings revenue, expenses, profit and cash together in one clear summary.
It shows what you earn, what you spend, what you keep, and how healthy your margin is. Because owners rarely have time to wade through accounting software, a simple dashboard is invaluable. So it turns scattered financial data into the handful of numbers that tell you how the business is really doing.
Why small businesses need this view
Many small businesses fail not from lack of sales but from losing track of the numbers. Money comes and goes, and the picture blurs.
A clear view of profit and margin shows whether the business is truly making money, not just moving it. Watching expenses by category reveals where costs creep up. Because you cannot fix what you cannot see, this clarity is the first step to control. So the dashboard gives owners the financial grip that keeps a business alive.
The profit and margin formula
Two figures tell you most of what you need: profit and margin. Both build on your revenue and expenses.
Profit = Revenue − Expenses
Profit margin = Profit ÷ Revenue
So profit is simply what remains after expenses come out of revenue. Margin expresses that profit as a share of revenue, showing how much of every pound you actually keep. A business with high revenue but a thin margin can be working hard for little reward. So margin, not just profit, reveals the real health of the business.
How the small business dashboard calculates the figures
The template needs your monthly revenue and expenses, plus your costs by category. From there it works out the rest.
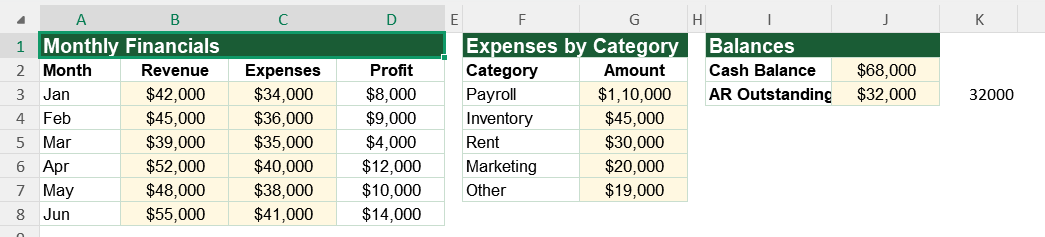
Monthly profit appears as =B3-C3, the revenue minus the expenses, for each month. The dashboard then totals revenue and expenses with SUM, works out net profit as the difference, and finds the margin by dividing profit by revenue. It also pulls in cash balance and receivables. So every figure updates the moment you enter a month’s numbers.
A worked profit example
Put numbers in and the maths is clear. Suppose a month brings in 42,000 in revenue against 34,000 in expenses.
The profit is 42,000 minus 34,000, which is 8,000. The margin is 8,000 divided by 42,000, or about 19%. So the business kept roughly nineteen pence of every pound it earned that month. Track that margin over time, and you can see whether the business is getting healthier or thinner.
Reading the charts
The first chart compares revenue with expenses each month, so profitable months stand out from tight ones. The second chart is a doughnut splitting expenses by category, showing where your money goes.
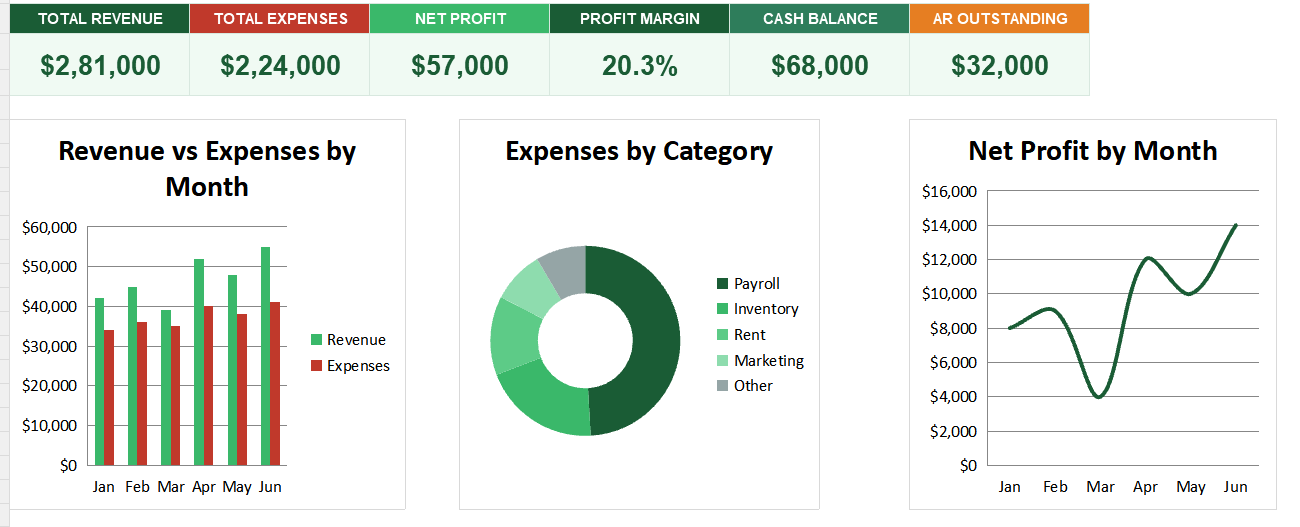
That breakdown often surprises owners, revealing a cost that has quietly grown. The third chart plots profit over time, showing the trend that matters most. Because you see income, costs and profit together, the whole picture emerges. So together the charts turn raw figures into a clear story of your business.
Watch your margin trend, not just monthly profit. A steady or rising margin means the business is getting healthier, even if revenue swings from month to month.
Who uses a small business dashboard
Small business owners use it to keep a firm grip on their finances. It shows them the health of the business at a glance.
Freelancers use it to track income against costs. Founders use it to watch profit as they grow. Bookkeepers use it to give clients a clear summary. Because every small business needs to know its numbers, the dashboard suits many settings.
Making the template your own
The template is a starting point, not a fixed form. You can extend it across a full year. You can change the expense categories to match your business.
The dashboard bends to your needs, so you can add a cash-flow line alongside profit. A quick edit does it. You might also track profit against a monthly target. The structure welcomes that kind of extension without complaint.
A small business runs best when its owner can see the numbers clearly. A small business dashboard shows revenue, expenses, profit and margin in one place, so nothing hides. So download the template, enter your figures, and take a firm grip on the financial health of your business.
Profit is not cash, and number don’t lie
One trap catches many owners: confusing profit with money in the bank. The two are not the same. Cash in the bank and the profit you see in your books of accounts are different.
You can show a healthy profit while your account runs dry, because customers pay late or stock swallows the cash. So the dashboard tracks cash balance and receivables alongside profit, giving a fuller picture. Because a profitable business can still run out of money, watching both is what keeps you safe.
The real power comes from updating the numbers every month without fail. A quick review becomes a habit that keeps surprises rare and decisions timely