
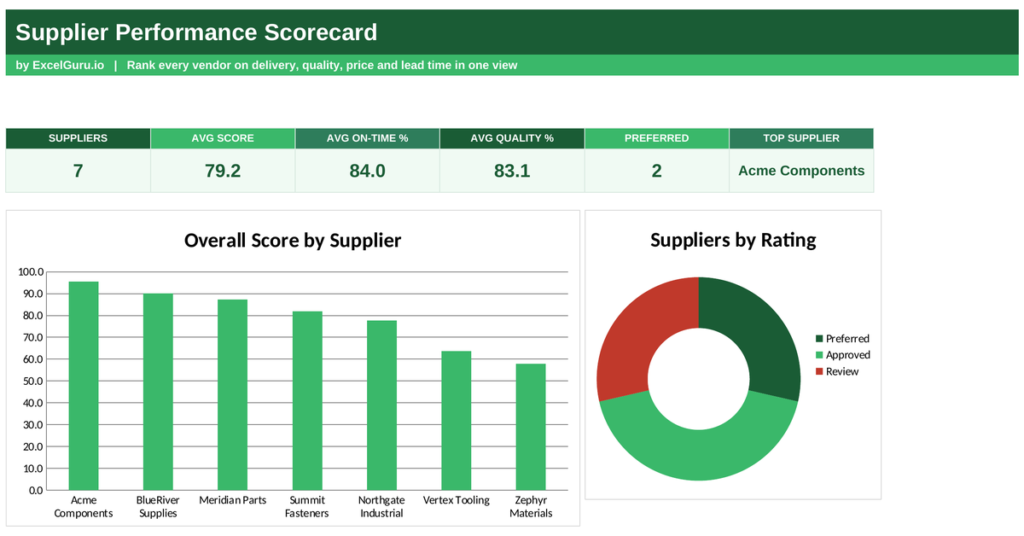
Choosing suppliers on price alone is how businesses end up with cheap parts that arrive late and fail inspection. A cheap supplier that misses deadlines can cost far more than a dearer one that never lets you down. A supplier performance scorecard replaces gut feel with an objective, weighted rating. This free Excel template scores every supplier on quality, delivery, price and lead time, then sorts them into clear tiers. Below you will learn what supplier scoring is, the formula behind it, and how the template rates each one.
What is a supplier performance scorecard?
A supplier performance scorecard is a structured way to rate your vendors on the things that actually matter. Instead of a vague sense that one supplier is better, it produces a single comparable score for each.
The idea is to judge every supplier against the same criteria. Quality, on-time delivery, price and lead time all feed into one number, so you can rank suppliers fairly and spot the weak links. Because a poor supplier creates hidden costs across your whole operation, measuring them protects the business. So the scorecard turns supplier management from opinion into evidence.
The supplier performance scoring formula
The scorecard blends several criteria into one weighted score. Each criterion carries a weight that reflects how much it matters to you.
Overall score = 0.3 × Quality + 0.3 × Delivery + 0.2 × Price + 0.2 × Lead-time score
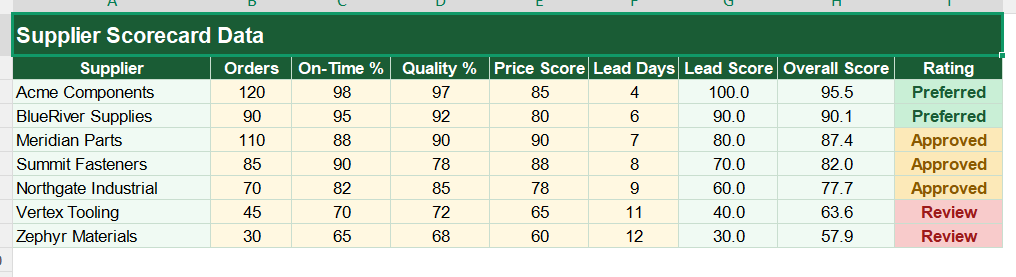
Rating: 90+ Preferred, 75–89 Approved, below 75 Review
So quality and delivery each carry 30% of the score, while price and lead time carry 20% each.
You can shift those weights to match your priorities. Lead time first becomes a score of its own, because raw days need converting to a common scale. A short lead time earns a high score, and each extra day costs a fixed amount. The overall score then drops each supplier into a tier, from preferred through approved to review.
How the template calculates the score
The template asks for each supplier’s quality, delivery and price scores, plus their lead time in days. From there it does the rest.
The lead-time score uses =MAX(0,MIN(100,100-(F3-5)*10)), which sets five days as a perfect 100 and docks ten points for each extra day, held between 0 and 100.
The overall score uses =0.3*C3+0.3*D3+0.2*E3+0.2*G3, the weighted blend of the four criteria. The rating uses =IF(H3>=90,”Preferred”,IF(H3>=75,”Approved”,”Review”)). To summarise, the dashboard counts each rating with COUNTIF and names your best supplier with INDEX and MATCH on the top score. So every rating updates the moment you change an input.
A worked scoring example
Follow one supplier and the maths is clear. Take Acme Components, which scores 98 on quality, 97 on delivery and 85 on price, with a four-day lead time.
Its lead time beats the five-day benchmark, so the lead-time score caps at 100. The overall score is 0.3 × 98 plus 0.3 × 97 plus 0.2 × 85 plus 0.2 × 100, which works out to 95.5. Because that clears 90, Acme earns a preferred rating. So a supplier that excels on quality and delivery rises to the top, even with a middling price.
Reading the charts
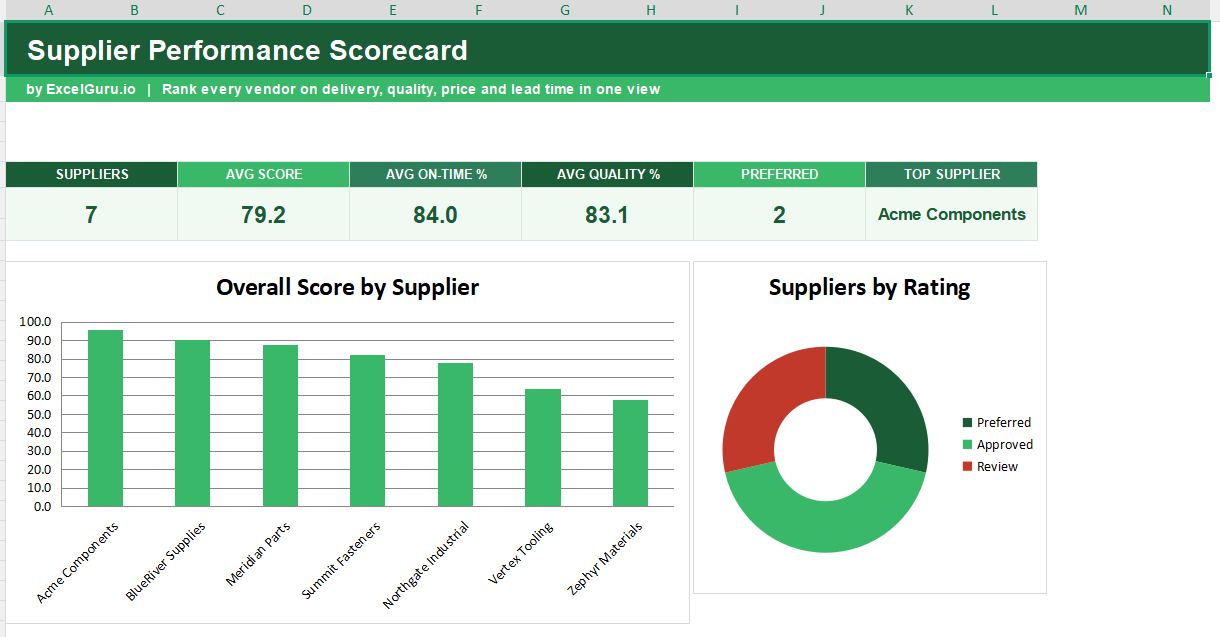
The first chart ranks every supplier by overall score. Tall bars mark your strongest partners, so the order of preference is instant.
The second chart is a doughnut that splits suppliers by rating, showing how many sit in each tier. A wide preferred slice means a reliable supply base, while a large review slice signals risk. Because you see the ranking and the tiers together, your sourcing decisions get easier. So together the charts show both who performs and how healthy your supplier base is overall.
Weight the criteria to match your business. If late delivery hurts you most, raise the delivery weight so the score rewards the suppliers who never miss a date.
Who uses a supplier scorecard
Procurement teams use it to compare vendors and steer spend to the best. It backs every sourcing decision with a score.
Operations managers use it to protect their supply chain from weak links. Small businesses use it to hold suppliers to a standard. Quality teams use it to track improvement over time. Because every business that buys from suppliers depends on their reliability, the scorecard suits many settings.
Making the template your own
The template is a starting point, not a fixed form. You can add suppliers as your base grows. You can change the criteria weights to fit your priorities.
The dashboard bends to your needs, so you can add a criterion such as responsiveness or compliance. A quick edit does it. You might also score each supplier every quarter to track whether they improve. The structure welcomes that kind of extension without complaint.
A reliable supply base is built on measurement, not on hope. A supplier performance scorecard scores every vendor on quality, delivery, price and lead time, then sorts them into clear tiers. So download the template, enter your suppliers, and let the scores show you who to trust with your business.
Why supplier performance matters
A weak supplier rarely fails in just one way. The damage spreads across your whole operation, often out of sight.
A late delivery can halt a production line, while poor quality triggers rework, returns and unhappy customers. Leaning on one unreliable supplier also adds risk, because a single failure can stop everything. So measuring supplier performance is really about protecting the cost, quality and continuity of your own business.