
Pay is one of the hardest things to get right and the easiest to get quietly wrong. Drift below the market, and good people leave without warning.
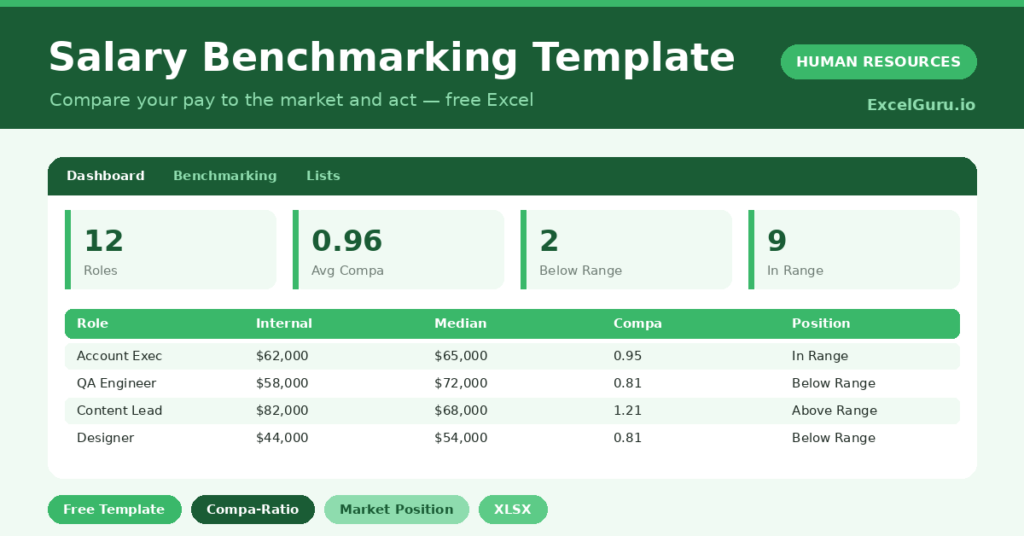
This free salary benchmarking template shows exactly where you stand. You enter internal and market pay, and the sheet flags every outlier. You will also find realistic sample data already inside the file. Therefore, you can explore every formula, dropdown and chart first, and then replace the samples with your own records in minutes.
Below, we explain the Compa-ratio, the formulas, and how to adapt the benchmark to your own data.
What Is Salary Benchmarking?
Salary benchmarking compares what you pay against what the market pays for the same role. It uses market percentiles as the yardstick.
From that comparison, it produces a Compa-ratio and a clear position. As a result, you can see at a glance whether each role is competitive.
Why Does Benchmarking Matter?
Pay that falls behind the market is a slow, hidden risk. People rarely complain; they simply leave for a better offer.
Benchmarking makes that risk visible before it bites. Therefore, you can fix below-market roles and defend your pay decisions with data. It also helps you control cost by spotting roles paid above the range.
Why Use This Template?
A clear benchmark keeps pay competitive and fair. In particular, this one helps you:
- Compare internal pay to market percentiles.
- Calculate a Compa-ratio for every role.
- Flag roles below or above the market range.
- Quantify the variance against the median.
- Prioritize the pay actions that matter.
What’s Inside the Template?
The workbook has four tabs:
- How to Use — a built-in guide.
- Dashboard — Compa-ratio and market-position KPIs.
- Benchmarking — one row per role.
- Lists — department and action dropdowns.
What Formulas Does the Template Use?
The benchmark uses dependable Excel formulas:
| Formula | What it does |
| =Internal Pay / Market Median | Calculates the Compa-ratio. |
| =IF(Pay<25th,”Below Range”,…) | Flags the market position. |
| =Internal Pay – Market Median | Calculates the variance in money. |
| =(Internal – Median) / Median | Calculates the variance as a percentage. |
| =AVERAGEIF(Compa-Ratio,”>0″) | Calculates the average Compa-ratio. |
How Do You Use the Template?
The benchmark is quick to run. Just follow these steps:
- Open the Benchmarking tab and list your roles.
- Enter the internal average pay for each.
- Add the market 25th, median and 75th percentiles.
- Let the Compa-ratio and position calculate.
- Set an action for the outliers.
- Review the position split on the Dashboard.
What Are the Best Use Cases?
The benchmark fits many teams, such as:
- HR teams reviewing pay competitiveness.
- Compensation teams setting salary ranges.
- Founders checking pay before a raise round.
- Finance teams modelling pay adjustments.
- Anyone defending pay decisions with data.
How Can You Modify the Template?
You can tailor it freely. To refine the view, add columns for location or seniority and benchmark within each group.
You can also weight roles by headcount to see where the biggest pay gaps sit.
Moreover, the sheet covers 40 roles by default, and you can copy the formula row downward for more.
What Mistakes Should You Avoid?
A few habits weaken the benchmark. Therefore, avoid these common mistakes:
- Using old or unreliable market data.
- Comparing roles that are not really alike.
- Acting on a single role without seeing the pattern.
- Ignoring location differences in pay.
Tips to Get the Most From It
- Use recent, reliable market data sources.
- Match roles carefully before comparing pay.
- Prioritize below-range roles to reduce attrition risk.
- Re-run the benchmark each year as the market moves.
Frequently Asked Questions
What is a Compa-ratio?
It is internal pay divided by the market median. A figure near one means you pay around the market rate, below one means under, and above one means over.
What do the position labels mean?
Below Range means pay sits under the market 25th percentile, Above Range means over the 75th, and In Range means between the two.
Where do I get market data?
Use salary surveys, industry reports or reputable pay databases. The quality of your benchmark depends entirely on the quality of that data.
Should I act on every outlier?
Look at the pattern first. Prioritize below-range roles that carry attrition risk, and review above-range roles for cost rather than cutting pay.
Does it work in Google Sheets?
It does, with minor adjustments to formatting after importing.
Download the Template and Get Started
Competitive pay keeps good people and protects your budget. This template shows you exactly where to act.
Download the Salary Benchmarking Template and check your pay against the market today.