Some stock simply stops selling. It sits on the shelf, looks harmless, and quietly drains cash, space and attention.
This free dead and slow-moving stock report drags that stock into the open. It classifies every item by how recently it sold and flags the laggards. You will also find realistic sample data already inside the file. Therefore, you can explore every formula, dropdown and chart first, and then replace the samples with your own records in minutes. Below, we explain the classes, the formulas, and how to adapt the report to your own catalogue.
What Is a Dead Stock Report?
A dead stock report identifies items that have stopped or nearly stopped selling. It measures how long each item has gone without a sale.
From that gap, it sorts items into active, slow and dead classes. As a result, you can see exactly which stock is no longer working for you.
Why Does Dead Stock Matter?
Dead stock is cash frozen on a shelf. It also takes up space that profitable, fast-moving items could use instead.
Finding it early gives you options. Therefore, you can discount, bundle or return slow stock while it still holds value. Left alone, the same stock usually ends as a full write-off.
Why Use This Template?
A clear report turns idle stock into action. In particular, this one helps you:
- Classify every item by sales activity.
- Flag dead and slow stock automatically.
- Total the cash tied up in idle stock.
- Plan an action for each at-risk item.
- Free up space and working capital.
What’s Inside the Template?
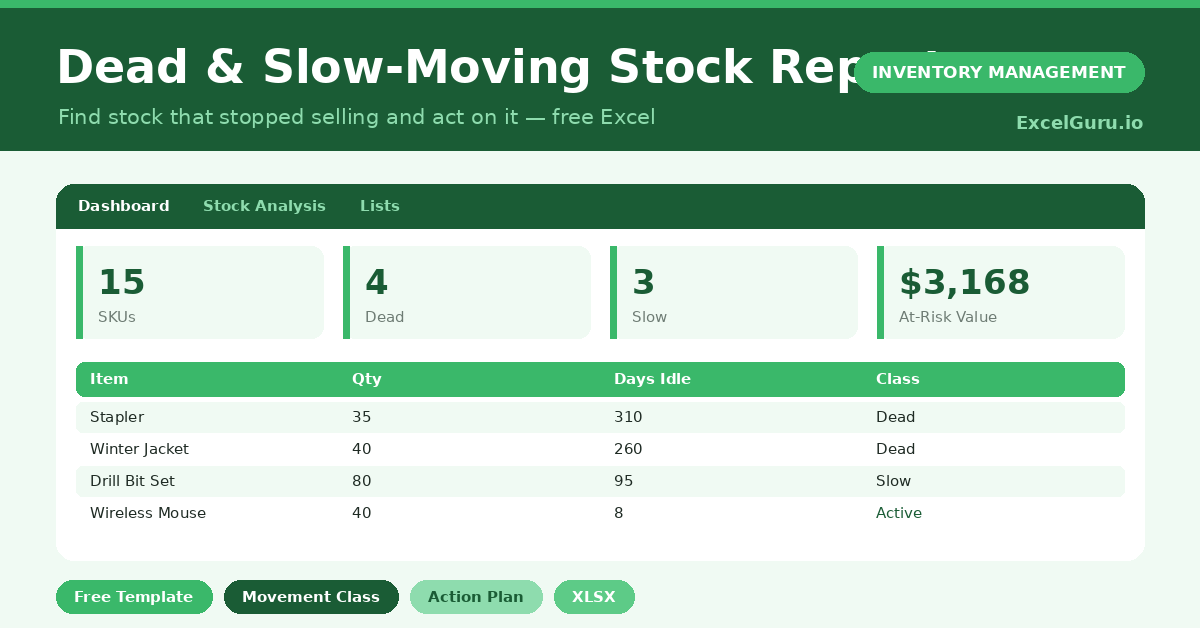
The workbook has four tabs:
- How to Use — a built-in guide.
- Dashboard — class counts, value at risk and charts.
- Stock Analysis — one row per item.
- Lists — category and action dropdowns.
What Formulas Does the Template Use?
The report uses dependable Excel formulas:
| Formula | What it does |
| =TODAY() – Last Sale Date | Calculates the days since the last sale. |
| =IF(Days>180 or no sales,”Dead”,…) | Classifies the movement of each item. |
| =Qty on Hand * Unit Cost | Calculates the stock value at risk. |
| =SUMIF(Class,”Dead”,Value)+… | Totals the value of dead and slow stock. |
| =COUNTIF(Class,”Dead”) | Counts the dead items. |
How Do You Use the Template?
The report builds from a few inputs. Just follow these steps:
- Open the Stock Analysis tab and list your items.
- Enter quantity on hand and unit cost.
- Add the last sale date for each item.
- Enter units sold in the past 90 days.
- Let value, days idle and class calculate.
- Choose an action and review the Dashboard.
What Are the Best Use Cases?
The report fits many businesses, such as:
- Retailers clearing tired ranges.
- E-commerce sellers pruning catalogues.
- Distributors freeing warehouse space.
- Finance teams reviewing obsolete stock.
- Buyers learning which lines to drop.
How Can You Modify the Template?
You can adapt it easily. To change the thresholds, edit the 30, 90 and 180 day figures in the class formula.
You can also add a margin column to prioritise which slow items to clear first.
Moreover, the sheet covers 40 items by default, and you can copy the formulas down for more.
What Mistakes Should You Avoid?
A few habits weaken the report. Therefore, avoid these common mistakes:
- Leaving the last sale date blank, which hides the class.
- Treating dead stock as a problem for later.
- Reordering slow lines out of habit.
- Discounting too late, when value has already gone.
Tips to Get the Most From It
- Clear dead stock first, since it costs the most to hold.
- Update last sale dates from your sales system.
- Act on amber slow items before they turn dead.
- Review the report monthly to keep the catalogue lean.
Frequently Asked Questions
What is the difference between dead and slow stock?
Slow stock still sells, just rarely. Dead stock has not sold for a long time or not at all. The template separates the two so you can prioritise.
How does it classify items?
It uses the days since the last sale and recent units sold. Items with no recent sales or a very long gap are marked Dead.
What should I do with dead stock?
Consider discounts, bundles, returns to the supplier or a write-off. The action column helps you plan and track the decision.
Can I change what counts as slow?
Yes. Edit the day thresholds in the class formula to match how fast your products normally sell.
Does it work in Google Sheets?
It does, with minor adjustments to formatting after importing.
Download the Template and Get Started
Dead stock will not clear itself, and every week it costs you more. This report shows you what to act on and how.
Download the Dead & Slow-Moving Stock Report and free up your cash today.