Buying without a forecast is guessing with money. Order too much and cash sits idle; order too little and you miss sales you could have won.
This free demand forecasting template replaces the guess with a method. You enter six months of history, and the sheet projects next month two proven ways. You will also find realistic sample data already inside the file. Therefore, you can explore every formula, dropdown and chart first, and then replace the samples with your own records in minutes. Below, we explain the methods, the formulas, and how to adapt the forecast to your own products.
What Is a Demand Forecasting Template?
A demand forecasting template uses your recent sales history to estimate future demand. It applies simple statistical methods so you do not have to.
It also measures how erratic each item is. As a result, you can forecast steady items confidently and treat volatile ones with extra care.
Why Does Demand Forecasting Matter?
Almost every stock decision rests on an assumption about future demand. When that assumption is vague, both overstock and stockouts follow.
A forecast makes the assumption explicit and testable. Therefore, you can plan purchases, cash and space around a number rather than a hunch. Over time, comparing forecast with actual demand sharpens your planning further.
Why Use This Template?
A clear forecast steadies your whole supply chain. In particular, this one helps you:
- Project next month from real history.
- Compare a moving average with a weighted forecast.
- Measure demand variability per item.
- Suggest a stock level that allows for swings.
- Plan purchases and cash with confidence.
What’s Inside the Template?
The workbook has four tabs:
- How to Use — a built-in quick start guide.
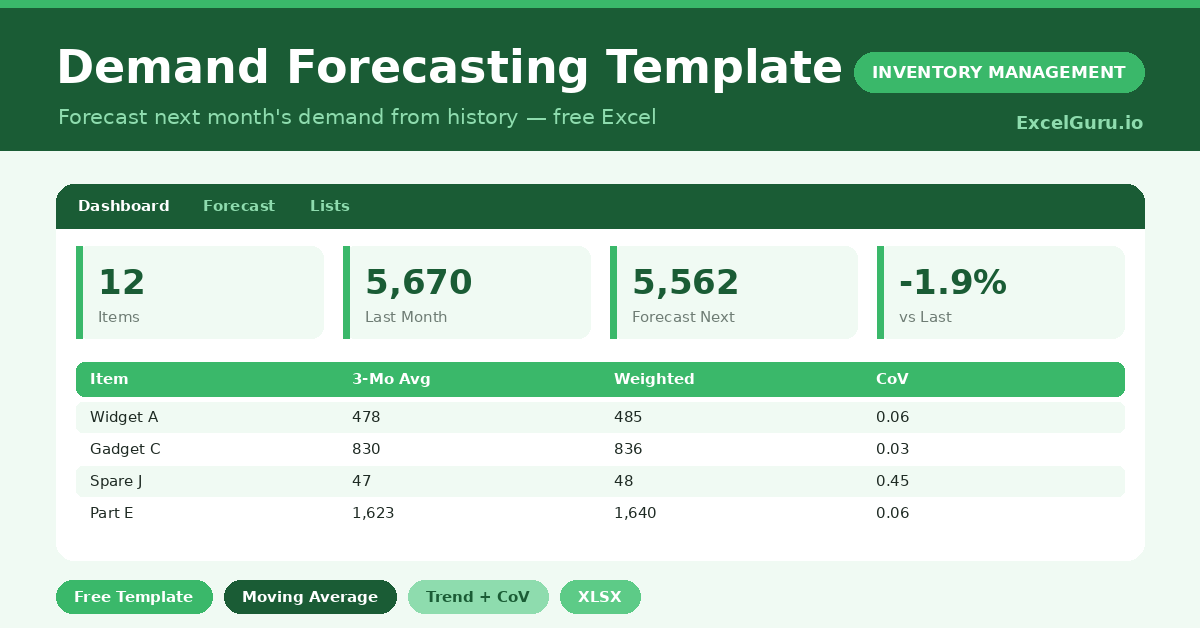
- Dashboard — total forecast, trend line and per-item chart.
- Forecast — six months of history and the projections.
- Lists — the forecasting method notes.
What Formulas Does the Template Use?
The forecast uses dependable Excel formulas:
| Formula | What it does |
| =AVERAGE(last 3 months) | Calculates the 3-month moving average. |
| =0.2*M3 + 0.3*M2 + 0.5*M1 | Calculates a weighted forecast favouring recent months. |
| =(Latest – Earliest) / 5 | Estimates the monthly trend. |
| =STDEV(history) / AVERAGE(history) | Calculates the coefficient of variation. |
| =ROUND(Forecast * (1 + CoV), 0) | Suggests a stock level with a variability buffer. |
How Do You Use the Template?
The forecast builds from your history. Just follow these steps:
- Open the Forecast tab and list your items.
- Enter the past six months of demand for each.
- Let the moving average and weighted forecast calculate.
- Check the variability figure for erratic items.
- Use the suggested stock level to plan orders.
- Review the trend and totals on the Dashboard.
What Are the Best Use Cases?
The template fits many businesses, such as:
- Retailers planning next month’s buy.
- Manufacturers scheduling production.
- Distributors managing replenishment.
- Finance teams projecting stock spend.
- Owners moving from gut feel to planning.
How Can You Modify the Template?
You can adapt it easily. To change the weighting, edit the factors in the weighted forecast so they match how fast your demand shifts.
You can also extend the history, adding more months and widening the average for a smoother forecast.
Moreover, the sheet covers 40 items by default, and you can copy the formulas down for more.
What Mistakes Should You Avoid?
A few habits weaken the forecast. Therefore, avoid these common mistakes:
- Forecasting from too little history.
- Ignoring the variability flag on erratic items.
- Treating a forecast as a fixed promise.
- Forgetting to refresh the history each month.
Tips to Get the Most From It
- Update the history every month for a current view.
- Add safety stock for high-variability items.
- Compare forecast to actual to test your accuracy.
- Adjust for known events like promotions or seasons.
Frequently Asked Questions
What is the difference between the two forecasts?
The moving average treats recent months equally. The weighted forecast leans on the latest month, so it reacts faster to a recent shift in demand.
What does the coefficient of variation tell me?
It measures how erratic an item’s demand is. A higher value means less predictable demand, so that item needs more safety stock.
How much history do I need?
Six months is a sensible minimum. More history smooths out noise, while seasonal products may need a full year to forecast well.
Can it handle seasonal demand?
It captures trend but not strong seasonality on its own. For seasonal items, adjust the forecast manually for the expected peak or dip.
Does it work in Google Sheets?
It does, with small tweaks. After importing, re-check the formulas and chart ranges.
Download the Template and Get Started
A good forecast turns purchasing from a gamble into a plan. This template gives you that forecast in minutes.
Download the Demand Forecasting Template and plan your next order with confidence today.