A blood pressure log gives your doctor something a single clinic reading never can: a picture over time. Blood pressure varies hour to hour, so one measurement tells only part of the story. A record of many readings tells far more.
This free template records your systolic, diastolic and pulse readings, then categorises each one against common reference ranges. It also tracks your averages. As a result, you build a clear history to share at your next appointment, rather than relying on a single number taken on a stressful clinic morning.
Important: this is a personal log, not a diagnostic tool, and it does not replace medical care. The categories are a general reference only. Discuss your readings with your doctor, and if you ever record a very high reading or feel unwell, seek medical help straight away.
What does the blood pressure log include?
The template is a simple log feeding a clear dashboard. You enter three numbers, and the sheet does the rest. In short, you get the following:
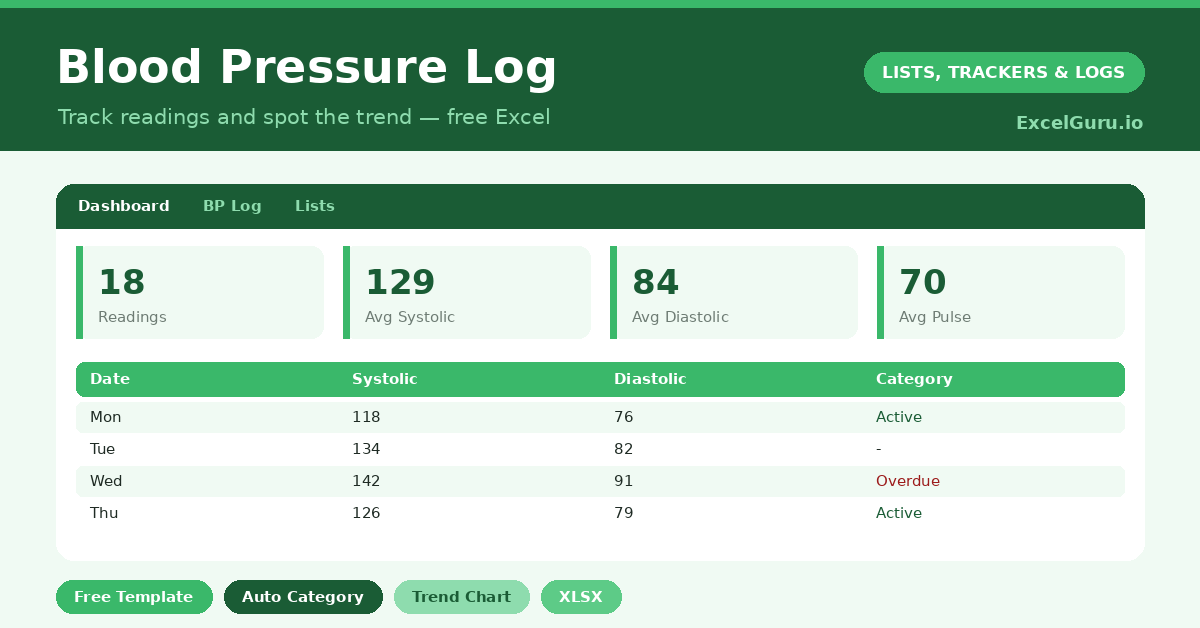
- A reading log with the date, time, systolic, diastolic and pulse for each measurement.
- An automatic category for every reading, based on common reference ranges.
- A notes column for context, such as a reading taken after exercise or stress.
- A dashboard showing readings logged, your average systolic, diastolic and pulse, normal readings and your highest systolic.
Which formula powers the blood pressure log?
The category is worked out for you with a nested IF. It checks each reading against common thresholds, so it can label a reading from normal up to a crisis range. For example, a reading at or above 180 over 120 is flagged as a crisis.
That flag exists for one reason: such a reading needs urgent medical attention, not a spreadsheet note. On the dashboard, AVERAGE gives your typical systolic, diastolic and pulse, while COUNTIF counts your normal readings. So you and your doctor can see both the trend and the outliers at a glance.
Why keep a blood pressure log?
Home monitoring is increasingly recommended, because clinic readings can be misleading. Some people spike with the anxiety of a doctor’s visit, a pattern often called white-coat effect. A home log captures your everyday numbers instead.
The trend is what matters most. A single reading can alarm or reassure for no good reason, while an average across many readings is genuinely informative. So the log helps your doctor make better decisions, and it helps you understand what affects your own readings. In short, it turns scattered numbers into useful evidence.
What does the dashboard reveal?
The dashboard focuses on averages, which is exactly right for blood pressure. Your average systolic and diastolic figures are far more meaningful than any single reading. So they give a fair picture of where you generally sit.
The normal-readings count shows how often you fall in a healthy range, and the highest systolic flags your most extreme reading for discussion. The notes column adds context, since a reading after coffee or a rush tells a different story. Because the dashboard summarizes gently, it informs the conversation with your doctor rather than replacing it.
How do you take good readings?
Consistency makes the log far more useful. So measure at the same times each day, such as morning and evening. Sit quietly for five minutes first, with your back supported and feet flat.
Rest your arm at heart height, and avoid caffeine or exercise just beforehand. Take the reading before any medication if your doctor advises it, and note anything unusual. Because steady conditions reduce false swings, your averages become more reliable. In short, good technique turns the log into evidence your doctor can actually trust.
What mistakes should you avoid?
The most important point bears repeating: the log does not diagnose anything. So never adjust medication or worry yourself based on the categories alone, and always involve your doctor.
On the practical side, do not cherry-pick readings, since deleting the high ones hides the truth from the person trying to help you. Log them all. And do not panic over a single reading, because variation is normal. The exception is a crisis-range reading or feeling unwell, which calls for immediate medical help rather than a calm note in a column.
Who should keep a blood pressure log?
Home monitoring suits several situations, always under a doctor’s guidance. People whose readings spike at the clinic benefit, because the log captures calmer everyday numbers. So does anyone starting or adjusting blood pressure medication, since the trend shows whether it is working.
A family history of high blood pressure is another good reason to keep one. In each case, the value is the same: a record over time that a doctor can actually use. So the log is less about any single reading and more about the steady picture only regular monitoring can give.
Frequently asked questions
Does the blood pressure log diagnose high blood pressure?
No. It records your readings and categorises them against common reference ranges for your information only. Diagnosis and treatment are matters for your doctor, who can interpret the full picture.
How does it categorise a reading?
A nested IF compares your systolic and diastolic numbers against common thresholds and labels each reading accordingly, up to flagging a crisis-range reading that needs urgent medical attention.
Why track averages instead of single readings?
Blood pressure naturally varies through the day, so one reading can mislead. An average across many readings gives a fairer picture, which is exactly what helps your doctor make good decisions.
Take your readings consistently, log every one, and bring the history to your appointments. The log turns scattered numbers into a clear trend your doctor can use. Always remember its limit, though: it records and summarizes, while the medical judgement stays firmly with the professionals.