
A project timeline turns a project from a hopeful list of tasks into a plan with a shape, a sequence and a finish date. A flat to-do list tells you what needs doing, but not when, in what order, or how it all fits together. So a timeline is what lets you actually see the path from start to launch.
This free template lays your tasks across phases, each with a start date, an end date and a progress percentage. So it calculates the duration and tracks how far along you are. As a result, you can see your whole plan at a glance and spot slippage before it derails the finish.
What does the project timeline include?
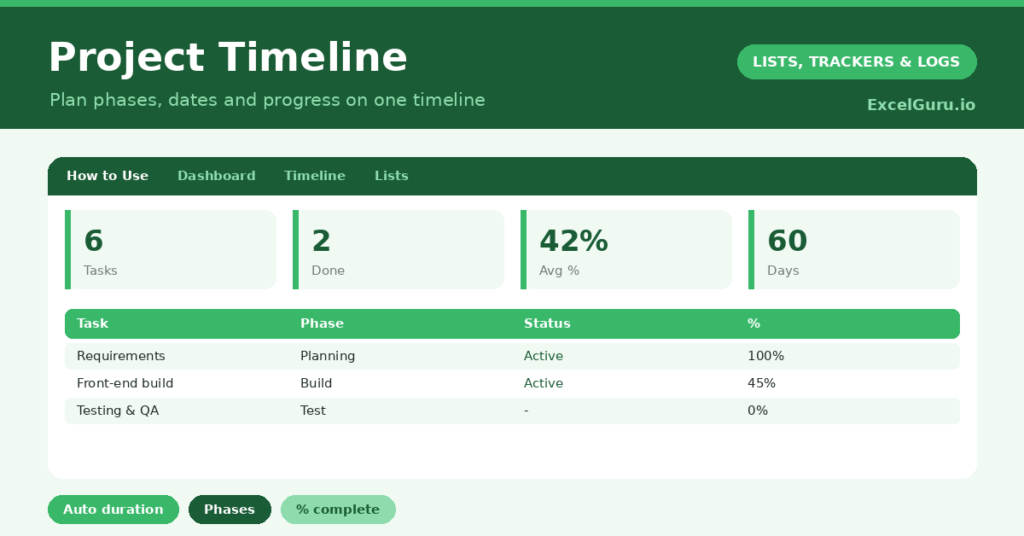
The template is one task sheet feeding a progress dashboard. Dropdowns keep phases and statuses tidy. In short, you get the following:
- A task table with the task, phase, owner, start date, end date, auto-calculated duration, status and percent complete.
- Drop-down lists for phase and status, so entries stay consistent.
- A dashboard showing total tasks, those completed and in progress, average percent complete, total days and your latest end date.
- Color-coded statuses, so done, in-progress and blocked tasks stand out.
- An automatic duration in days for every task.
Which formulas power the project timeline?
The duration is worked out for you. Each task’s duration is =End Date – Start Date + 1, so a task running from Monday to Friday correctly shows as five days, not four. That small plus-one makes the totals honest.
On the dashboard, an AVERAGE of the percent-complete column gives your overall momentum in a single figure. A MAX over the end dates surfaces your projected finish, and a SUM totals the working days across the plan. So you can read both how far along you are and when you will be done.
Why use a project timeline?
A timeline forces the thinking that a to-do list lets you skip. By giving each task a start and an end, you confront the sequence and the dependencies. So you notice early that testing cannot start until the build is done.
It also makes progress visible and honest. The average percent-complete figure cuts through optimistic updates with an actual number. The phases give the project a clear structure, and the latest end date keeps the finish in view. Furthermore, because the whole plan sits on one view, the team shares the same picture. In short, the timeline keeps a project moving in the right order.
What does the dashboard reveal?
The dashboard answers the questions every status meeting asks. The average percent-complete figure is the headline measure of momentum, and it should climb steadily as work gets done. So a stalled number is an early warning.
The completed and in-progress counts show the shape of the remaining work. The latest end date is the figure stakeholders care about most, since it is your projected finish. The total-days figure gives a sense of the overall effort. Because it all updates automatically, you walk into a review already knowing where the project stands. So the dashboard prevents nasty surprises.
How do you plan your projects with Excel?
Start by breaking the project into tasks and grouping them into phases, such as Planning, Build and Launch. So the plan has a clear structure. Then set realistic start and end dates, working out the sequence as you go.
Assign each task an owner, and update the status and percent complete as work progresses. Review the dashboard regularly, watching the average percent complete and the latest end date. Because slippage shows up in the numbers, you can act on it before it threatens the deadline. In short, the timeline turns a project into a sequence of clear, scheduled steps.
How do you customise it?
Edit the phases and statuses on the Lists tab to match your project. Additionally, you can add columns for dependencies, estimated hours, or a milestone flag for key dates. Sorting the tasks by start date gives you a natural top-to-bottom timeline. The template scales from a short personal project to a sizeable team effort with many phases.
What mistakes should you avoid?
The first mistake is creating tasks so large they hide slow progress until it is too late. So break work into pieces measured in days, not months. The second mistake is setting dates once and never adjusting them as reality shifts.
A timeline is a living plan, so update it as things move. Finally, do not neglect the percent-complete field, because the dashboard’s momentum figure depends on it. A quick, honest update keeps the whole plan trustworthy and the finish date realistic.
Frequently asked questions
How does the project timeline calculate duration?
Each task’s duration is its end date minus its start date plus one, so a task spanning Monday to Friday correctly shows five days. The dashboard then sums the durations across your whole plan.
Does it show my finish date?
Yes. A MAX over the end dates surfaces your latest task end as the projected finish, and the dashboard displays it alongside your average percent complete and task counts.
Can a team use it together?
Absolutely. Keep the file in a shared location, assign each task an owner, and update statuses and progress as work moves. Everyone then sees the same live picture of the plan.
Break the project into phased tasks, set realistic dates, and keep the progress current. The dashboard then shows momentum and your finish date at a glance. A project timeline is what turns a daunting project into a clear, ordered path you can actually follow to the end.