
Key takeaways
- The quickest way to summarize a spreadsheet is a repeatable script, not a hand-built pivot table you rebuild every time.
- Excel Summary & Pivot is free and open-source (MIT), built in Python with
pandas. - Group-by mode aggregates a value by category —
sum,mean,count,min, ormax. - Pivot mode builds a rows × columns cross-tab (e.g. region × product).
- Every summary includes a grand-total row (and total column in pivot mode).
To summarize Excel data, run a free tool called Excel Summary & Pivot, which turns raw
rows into group-by totals or a pivot-table cross-tab in one command. Total amount
per region, or build a region × product grid — complete with grand totals,
no manual pivot table required.
Why summarizing data by hand is a time sink
You have a flat export — every sale, every transaction, every entry as its own row — and you need the numbers rolled up: total per region, average per rep, count per product. In Excel you'd build a pivot table, drag fields around, and rebuild it each time the data refreshes.
A script turns that into one repeatable command. Point it at the raw data, name the group and the value, and get the same clean summary every time — with the totals already added.
How to install the tool (2 minutes)
You need Python 3.9 or newer. Clone the repository and install its dependencies:
git clone https://github.com/Synth88Labs/excel-tool-summary.git
cd excel-tool-summary
pip install -r requirements.txt
Get Excel Summary & Pivot on GitHub (free)
How to summarize Excel data — step by step
Option A — Group-by totals
Total a numeric column by a category. For example, total amount per region:
python summarize_excel.py sales.csv --group-by region --value amount -o summary.xlsxAdd more aggregations with --agg (comma-separated) — sum, mean,
count, min, max:
python summarize_excel.py sales.csv --group-by region --value amount --agg sum,mean,countOption B — Pivot table (cross-tab)
Turn one column into the grid's columns with --columns. For example,
region down the side and product across the top:
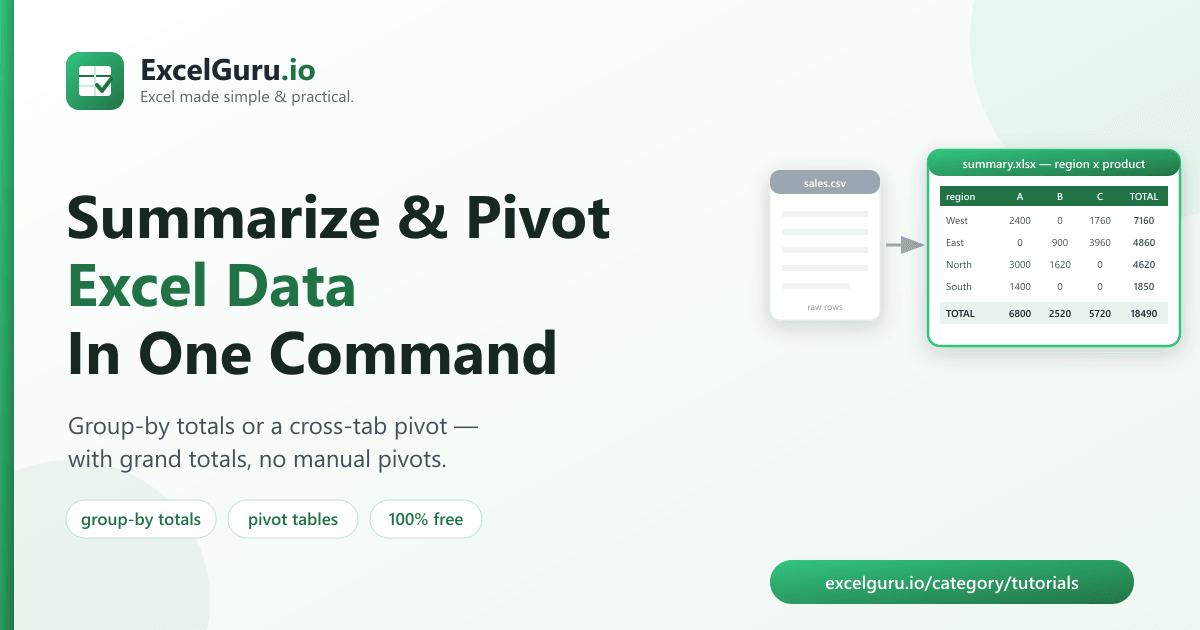
python summarize_excel.py sales.csv --group-by region --columns product --value amount -o pivot.xlsxYou get a full cross-tab with a grand-total row and column — the pivot table you'd normally build by hand.
openpyxl library can't create a pivot
table from code. This tool computes the pivot with pandas and writes it as a plain,
portable table anyone can open.
Example output
Group-by region with --agg sum:
| region | amount_sum |
|---|---|
| West | 7160 |
| East | 4860 |
| North | 4620 |
| South | 1850 |
| TOTAL | 18490 |
Pivot region × product:
| region | Widget A | Widget B | Widget C | Widget D | TOTAL |
|---|---|---|---|---|---|
| West | 2400 | 0 | 1760 | 3000 | 7160 |
| East | 0 | 900 | 3960 | 0 | 4860 |
| TOTAL | 6800 | 2520 | 5720 | 3450 | 18490 |
Real work use cases
- Sales by region or rep — totals and averages at a glance.
- Spend by category — sum expenses per department or vendor.
- Counts per status — how many orders are paid, pending, refunded.
- Cross-tab analysis — region × product, month × channel, and similar grids.
- Recurring dashboards — regenerate the same summary each time data updates.
Common mistakes to avoid
- Summing a text column. The value column must be numeric; the tool coerces
number-like text but skips anything it can't parse (like
"1,200"with a comma — clean it first). - Grouping by a unique column. Grouping by an ID gives one row per record — group by a category instead.
- Expecting mean totals to add up. With
--agg mean, the TOTAL row is the overall average, not the sum of the group averages. - Too many pivot columns. A high-cardinality
--columnsfield creates a very wide grid — pick a column with a manageable set of values.
Frequently asked questions
How do I group by and sum in Excel using Python?
Run python summarize_excel.py data.csv --group-by COLUMN --value NUMERIC_COLUMN. The tool
groups the rows and totals the value column, adding a grand-total row.
Can it create a pivot table?
Yes. Add --columns COLUMN to build a cross-tab (pivot) with the values of that column as
the grid's columns, plus grand totals.
What aggregations are supported?
sum, mean, count, min, and max — one
or several at once via --agg sum,mean.
Can I group by more than one column?
Yes. Pass a comma-separated list to --group-by, for example
--group-by region,salesperson.
Is Excel Summary & Pivot free?
Yes. It's open-source under the MIT license, free for personal and commercial use. The source is on GitHub.
Do I need Excel installed?
No. It reads and writes files with Python libraries, so it works without Microsoft Excel installed.
Why not just use openpyxl for a pivot table?
The openpyxl library can't build a pivot table from code. This tool computes the pivot
with pandas and writes it as a portable table instead.
Summary
Building the same pivot table by hand every week is wasted effort. Excel Summary & Pivot turns raw rows into group-by totals or a cross-tab pivot in one command — with grand totals, styled output, and no manual dragging. It's free, open-source, and works without Excel installed.