
Most teams have hidden skill gaps they only discover at the worst moment. The one person who knew how is away, and suddenly the work stalls.
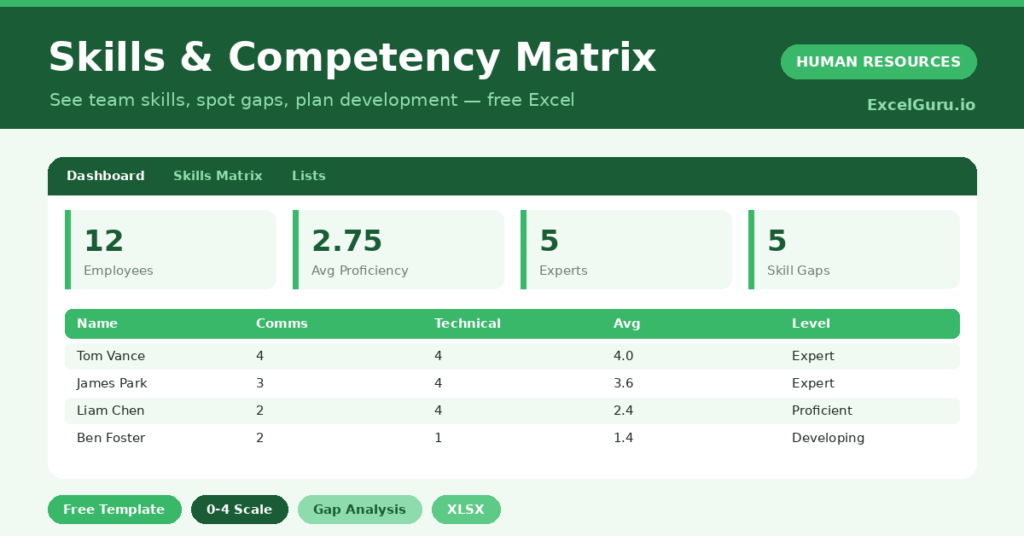
This free skills matrix makes capability visible. You rate proficiency across key skills, and the sheet shows averages, gaps and levels at a glance. You will also find realistic sample data already inside the file. Therefore, you can explore every formula, dropdown and chart first, and then replace the samples with your own records in minutes.
Below, we explain the scale, the formulas, and how to adapt the matrix to your own skills.
What Is a Skills Matrix?
A skills matrix maps every employee against the skills your team needs. Each cell rates one person’s proficiency in one skill.
From those ratings, it calculates an average and counts the gaps. As a result, you can see your strengths and weaknesses on a single page.
Why Does a Skills Matrix Matter?
Skill gaps are a quiet risk until they become an urgent one. A matrix surfaces them early, while you still have time to act.
It also guides where to invest in development. Therefore, you can train deliberately, plan cover for key skills and reduce your reliance on any single person. A clear view of capability supports almost every people decision you make.
Why Use This Template?
A clear matrix turns capability into a plan. In particular, this one helps you:
- Rate proficiency across key skills.
- Calculate an average proficiency per person.
- Count skill gaps automatically.
- See which skills are weak across the team.
- Plan training where it is needed most.
What’s Inside the Template?
The workbook has four tabs:
- How to Use — a built-in guide.
- Dashboard — proficiency by skill and level KPIs.
- Skills Matrix — the grid of people and skills.
- Lists — the proficiency scale.
What Formulas Does the Template Use?
The matrix uses dependable Excel formulas:
| Formula | What it does |
| =AVERAGE(skill scores) | Calculates average proficiency per person. |
| =COUNTIF(skills, “<2”) | Counts the skill gaps for each person. |
| =IF(Average>=3,”Expert”,…) | Assigns an overall proficiency level. |
| =AVERAGE(skill column) | Calculates the average for each skill. |
| =SUMPRODUCT(–(matrix<2)) | Counts skill gaps across the whole team. |
How Do You Use the Template?
The matrix is quick to maintain. Just follow these steps:
- Open the Skills Matrix tab and list your team.
- Rate each skill from 0 to 4.
- Let the average, gaps and level calculate.
- Scan the colours for weak spots.
- Read the skill averages on the Dashboard.
- Plan training where the team is weakest.
What Are the Best Use Cases?
The matrix fits many teams, such as:
- Managers planning team development.
- HR teams mapping organisational capability.
- Operations teams ensuring cover for key skills.
- Project leads matching people to work.
- Anyone reducing single-person dependencies.
How Can You Modify the Template?
You can tailor it freely. To change the skills, rename the columns to match the capabilities you care about.
You can also set a target level per skill and compare each person against it.
Moreover, the sheet covers 40 employees by default, and you can copy the formula row downward for more.
What Mistakes Should You Avoid?
A few habits weaken the matrix. Therefore, avoid these common mistakes:
- Rating without a shared definition of each level.
- Confusing confidence with real proficiency.
- Tracking skills the team does not actually need.
- Building the matrix and never acting on the gaps.
Tips to Get the Most From It
- Agree what each proficiency level means first.
- Rate honestly, including your own gaps.
- Use the skill averages to plan group training.
- Revisit the matrix after development to see progress.
Frequently Asked Questions
What does the proficiency scale mean?
It runs from 0 for none to 4 for expert. A shared definition of each level is what keeps ratings fair and comparable across the team.
How are skill gaps counted?
The matrix counts any rating below 2 as a gap. This highlights skills where someone is, at best, only at a basic level.
Can I set target levels?
Yes. Add a target row or column per skill and compare each person’s rating against it to see where development is needed.
How is this different from a training matrix?
A training matrix tracks whether courses are completed. This skills matrix rates how proficient each person actually is, which is a deeper measure.
Does it work in Google Sheets?
It does, with minor adjustments to dropdowns and conditional formatting after importing.
Download the Template and Get Started
You cannot develop what you cannot see. This matrix shows your team’s real capability and where to grow it.
Download the Skills & Competency Matrix Template and map your team today.