A fuel log tells you the truth about what your car costs to run, beyond the figure on the showroom sticker. Real-world economy depends on how and where you drive, and it rarely matches the official claim. So the only way to know your true MPG is to measure it.
This free template records each fill-up and works out your miles, price per gallon and MPG automatically. It then shows your average economy and total spend. As a result, you can spot a sudden drop that hints at a fault, compare driving styles, and see exactly where your fuel money goes.
What does the fuel log include?
The template is one fill-up log feeding a clear dashboard. In short, you get the following:
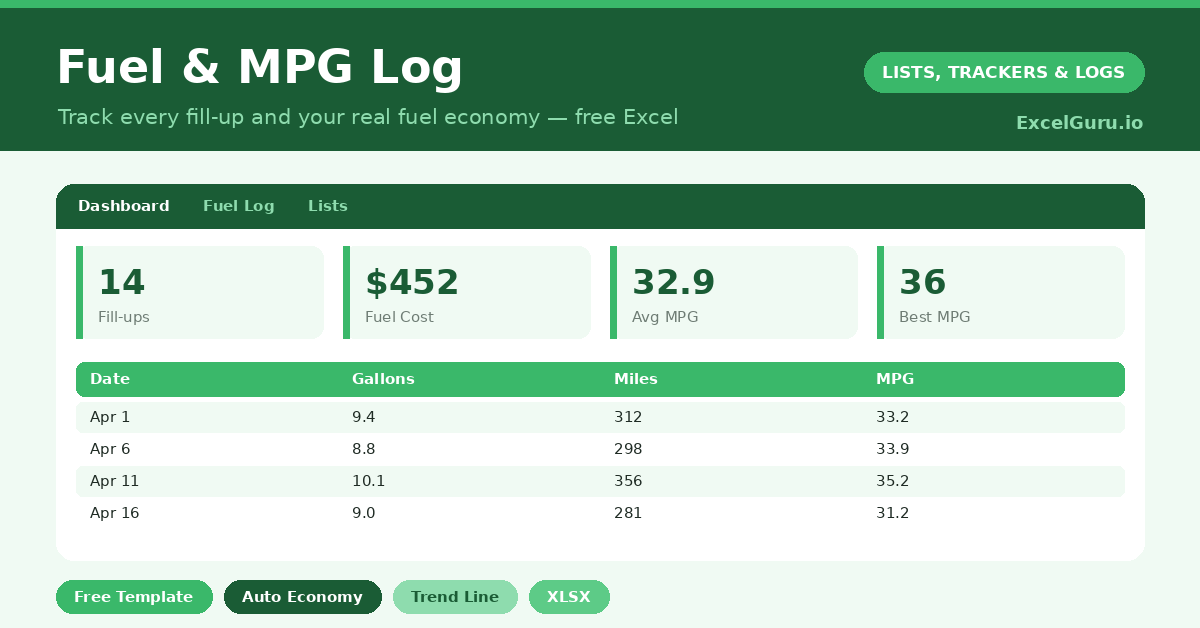
- A fuel log with the date, odometer reading, gallons, cost, and auto-calculated price per gallon, miles and MPG.
- Automatic MPG and miles for every fill-up, with no calculations from you.
- A notes column for context, such as a long motorway trip or city driving.
- A dashboard showing fill-ups logged, total spent, total miles, your average MPG, average price per gallon and your best MPG.
Which formulas power the fuel log?
Three small formulas turn raw numbers into insight. Miles is the difference between this odometer reading and the last, written =IF(OR(Odometer=””, NOT(ISNUMBER(PrevOdometer))), “”, Odometer – PrevOdometer) so the first row and any gaps stay blank.
MPG is then =Miles / Gallons, and price per gallon is =Cost / Gallons. On the dashboard, an AVERAGEIF gives your typical MPG while ignoring blank rows, a SUM totals your spend, and a MAX finds your best-ever tank. So the log converts a stack of receipts into the numbers that actually matter.
Why keep a fuel log?
The first reason is awareness of cost. Fuel is a major running expense, yet most drivers have only a vague sense of what they spend. A log makes it concrete. So budgeting and comparing journeys become easy.
The second reason is diagnostics. A steady MPG that suddenly drops is often the first sign of a mechanical issue, such as under-inflated tires or a failing part. Because you can see the trend, you catch it early. The log also reveals how much your driving style affects economy. In short, it turns fuel from a mystery into a measurable, manageable cost.
What does the dashboard reveal?
The dashboard sums up your motoring at a glance. The average-MPG figure is the headline measure of your car’s real economy, and it is the one to watch over time. A falling average is a useful early warning.
The total-spent figure shows the true cost of your driving, which is often higher than expected. The average price per gallon tracks what you are paying at the pump, and your best MPG sets a gentle target to beat. Because the numbers build with every fill-up, the trend becomes clear within a month or two. So the dashboard makes your fuel costs genuinely visible.
How do you use it?
The habit is simple: log every fill-up at the pump or as soon as you get home. So the record stays complete. Each time, enter the odometer reading, the gallons and the cost, and the formulas handle the rest.
For the cleanest MPG, fill the tank fully each time, since a brim-to-brim method gives the most accurate figures. Add a note for unusual journeys, like a long holiday drive, which explains any outliers. After a handful of fill-ups, the dashboard starts telling a clear story. The whole routine takes under a minute each visit.
How do you customize it?
If you measure fuel in liters and distance in miles or kilometers, simply rename the headers, because the formulas only care about the numbers. Additionally, you can add a column for the fuel station or the type of driving, which helps explain economy differences. Drivers with more than one vehicle can add a car column and filter by it. The log adapts to how you actually drive.
What mistakes should you avoid?
The first mistake is logging fill-ups inconsistently, which makes the miles and MPG unreliable. So record every visit, and always note the odometer reading. The second mistake is part-filling the tank, since brim-to-brim fills give far more accurate MPG.
Finally, do not panic over a single odd figure. One low tank can be a long idle or a transcription slip. The trend across several fill-ups is what matters, so watch the average rather than any one number. A steady record is what makes the insights trustworthy.
Frequently asked questions
How does the fuel log calculate MPG?
It works out the miles driven since your last fill-up from the odometer readings, then divides by the gallons added. An AVERAGEIF on the dashboard gives your overall average MPG, ignoring any blank rows.
Can I use liters instead of gallons?
Yes. Rename the headers to suit your units, and enter your numbers consistently. The formulas simply work with whatever figures you log, whether that is gallons or liters.
Why should I fill the tank fully each time?
A brim-to-brim fill gives the most accurate MPG, because you are measuring the exact fuel used over a known distance. Part-fills make the per-tank economy figures less reliable.
Log every fill-up, fill the tank fully, and let the formulas do the calculations. The dashboard then reveals your real economy and true running costs. A fuel log is a one-minute habit at the pump that quietly tells you everything the showroom sticker never could.