
A quality control log is how a small operation keeps quality from slipping unnoticed, one batch at a time. A vague sense that “things seem fine” is no substitute for a number, and by the time customers complain, the problem is already expensive. So recording each inspection and its defect rate catches trouble while it is still cheap to fix.
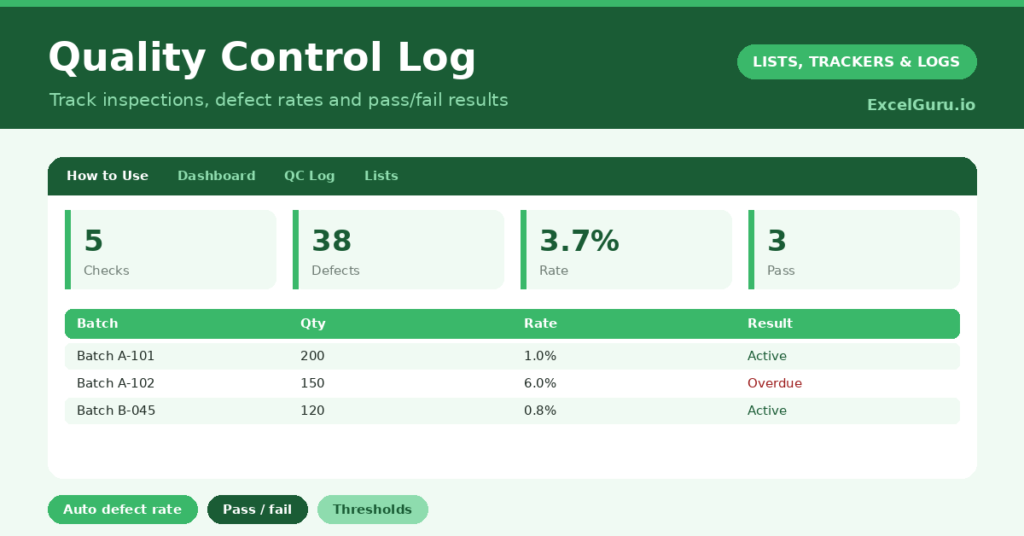
This free template records each inspection with the quantity checked and the defects found. So it calculates the defect rate and assigns a pass, review or fail result automatically. As a result, you can see your quality trend at a glance and act on a bad batch before it ships.
Also explore Safety Inspection Log Excel Template.
What does the quality control log include?
The template is one inspection log feeding a clear dashboard. In short, you get the following:
- An inspection log with the date, batch or item, inspector, quantity checked, defects, an auto-calculated defect rate, result and notes.
- An automatic defect rate and a Pass / Review / Fail result for every inspection.
- Color-coded results, so failing batches stand out in red.
- A notes column for the cause or the corrective action.
- A dashboard showing inspections, total checked, total defects, the overall defect rate, and pass and fail counts.
Which formulas power the quality control log?
Two formulas turn raw counts into a verdict. The defect rate is =Defects / Checked, so 9 defects in 150 items reads as 6%. That single figure is the heart of the log.
The result then uses a nested IF: a rate at or below 2% reads Pass, up to 5% reads Review, and anything higher reads Fail. So each batch gets an instant verdict against your thresholds. On the dashboard, the overall defect rate is =SUM(defects) / SUM(checked), which weights by volume rather than treating every batch equally. So the headline figure is genuinely accurate.
Why use a quality control log?
The first benefit is early detection. A rising defect rate is the first sign of a problem, whether a worn machine or a poor supplier batch. So you catch it before a flood of complaints arrives.
The second benefit is evidence. A documented log proves your quality process to customers, auditors and your own team. It also pinpoints where defects come from, since you can filter by item, supplier or inspector. Furthermore, the trend over time shows whether your improvements actually work. In short, the log turns a gut feeling about quality into hard, actionable data.
What does the dashboard in this template reveal?
The dashboard sums up your quality at a glance. The overall defect rate is the headline, and because it weights by volume, it reflects reality rather than a misleading average of batches. So it is a figure you can trust.
The pass and fail counts show how many batches met the standard and how many did not. The total-checked and total-defects figures give a sense of scale. Because it all updates as you log inspections, you can watch the trend and see whether a fix has worked. So the dashboard keeps quality firmly under control rather than left to chance.
How do you use this template efficiently?
Record each inspection as you carry it out, entering the quantity checked and the defects found. So the result calculates immediately. Use the notes column to capture the cause of any failure and the action you took.
Review the dashboard regularly, watching the overall defect rate and the fail count. When a batch fails, investigate the cause before the next run. Because every inspection feeds the trend, you can tell whether a change genuinely improved quality. In short, the log turns inspection from a tick-box exercise into a tool for steady improvement.
How do you customize it?
Adjust the pass and review thresholds in the result formula to match your own quality standards, since 2% and 5% are only sensible defaults. Additionally, you can add columns for the defect type, the supplier, or a corrective-action reference. A column for the production line helps if you run several. The template adapts to manufacturing, food production, print, or any process with a measurable defect rate.
What mistakes should you avoid?
The first mistake is using thresholds that do not fit your product, which makes the pass and fail labels meaningless. So set them to your real standards. The second mistake is recording the numbers but never investigating a failure.
A fail is a prompt to act, not just a label, so always follow up. Finally, do not inspect inconsistently. A defect rate only tells a story if you sample reliably, so keep your checking method and sample sizes steady. Consistent inspection is what makes the trend trustworthy.
Frequently asked questions
How does the quality control log calculate the defect rate?
It divides the defects found by the quantity checked for each inspection. The dashboard’s overall rate divides total defects by total checked, so it weights by volume rather than averaging the batches.
Can I set my own pass and fail thresholds?
Yes. The result formula uses 2% for a pass and 5% for review by default, but you can edit those figures to match your own quality standards in seconds.
What does the Review result mean?
Review sits between Pass and Fail. It flags a batch whose defect rate is higher than ideal but not yet a clear failure, so you can keep an eye on it or investigate before it worsens.
Log each inspection, let the result calculate, and act on every failure. The dashboard then keeps your defect rate and trend in view. A quality control log turns a vague hope that quality is holding up into a clear, documented number you can actually manage and improve.