
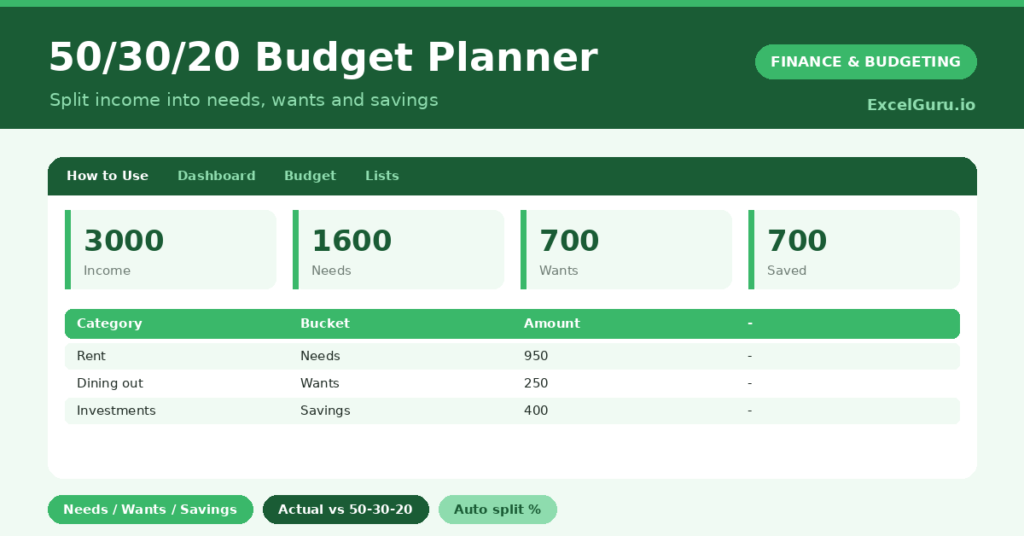
The 50/30/20 budget is the simplest budgeting rule there is, which is exactly why it works for so many people. Instead of tracking dozens of categories, you split your take-home pay three ways: 50% to needs, 30% to wants and 20% to savings. So it gives you a clear, memorable framework without the fuss of a detailed budget.
This free template lets you tag each expense as a need, a want or savings, then shows your actual split against the rule. So you can see at a glance whether you are within the 50/30/20 guideline. As a result, you get a balanced budget with almost no effort.
What does the 50/30/20 budget include?
The template is one budget table feeding a clear dashboard. A dropdown keeps the buckets tidy. In short, you get the following:
- A budget table with the category, bucket, amount and notes.
- A dropdown to tag each line as Income, Needs, Wants or Savings.
- Colour-coded buckets, so the three categories are easy to scan.
- A live comparison of your actual split against the 50/30/20 targets.
- A dashboard showing your income, your needs, wants and savings totals, and your actual Needs % and Savings %.

Which formulas power the 50/30/20 budget?
The dashboard does the splitting for you. A SUMIF totals each bucket: your income, your needs, your wants and your savings. So the three-way split appears automatically as you tag each line.
The key checks are the percentages. Your Needs % is =Needs / Income and your Savings % is =Savings / Income, so you can compare them directly against the 50% and 20% targets. So the template tells you not just where your money goes, but whether it matches the rule you are aiming for.
Why use a 50/30/20 budget?
The first benefit is simplicity. Detailed budgets fail because they are tedious, whereas three buckets are easy to maintain. So you are far more likely to stick with it.
The second benefit is balance. The rule builds in saving from the start, at a healthy 20%, while still allowing 30% for the things you enjoy. That balance is what makes it sustainable rather than punishing. The framework also makes it obvious when needs are crowding out everything else. Furthermore, the percentages give you a clear target to adjust toward. In short, the 50/30/20 budget is the easiest way to keep your finances balanced.
What does the dashboard reveal?
The dashboard shows your split at a glance. The Needs % is the figure that matters most, since needs creeping well above 50% is the classic sign of a stretched budget. So it is the number to watch.
The Savings % shows whether you are hitting that important 20%, which is where long-term progress comes from. The three bucket totals show the actual money in each, and the income figure anchors them. Because the percentages update as you tag lines, you can rebalance in real time. So the dashboard keeps your budget healthy and simple. The dashboard may simply look like a number card but it is useful and serves the purpose.

How do you use it?
Start by entering your monthly take-home pay as the Income line. So the percentages have a base to work from. Then tag each expense as a Need, a Want or Savings using the dropdown.
Needs are the essentials you cannot avoid, like rent and food; wants are the nice-to-haves; savings includes investments and extra debt payments. Check your Needs % and Savings % against the 50% and 20% targets, and rebalance if they are off. Because the rule is simple, adjusting is easy. In short, tag your spending and nudge the percentages toward the targets.
How do you customize it?
The buckets are fixed by the rule, but you can add as many categories within each as you like. Additionally, you can add columns for a budgeted amount alongside the actual, or a notes field for context. Some people adapt the ratios, such as 60/20/20, if their situation calls for it. The template flexes to your income and your priorities.
What mistakes should you avoid?
The first mistake is miscategorising wants as needs, which quietly inflates your needs percentage. So be honest: a basic phone plan is a need, the latest handset is a want. The second mistake is treating the ratios as rigid law.
They are a guideline, not a rule, so adapt them to your circumstances. Finally, remember this is a budgeting framework, not financial advice; a qualified adviser can help with bigger choices. The 50/30/20 split is a starting point for balance, so use it to guide your spending rather than to judge it.
Frequently asked questions
What counts as a need versus a want?
Needs are essentials you cannot reasonably avoid, such as rent, basic food and utilities. Wants are the nice-to-haves, like dining out or upgrades. Being honest about the difference is what keeps the split meaningful.
Does saving really need to be 20%?
Twenty percent is the guideline, and it is a healthy target, but it is not rigid. If your needs are high, you might start lower and build up. The template shows your actual percentage so you can aim toward it.
Can I change the ratios?
Yes. The 50/30/20 split is a starting point, not a law. Some people use 60/20/20 or other ratios to suit their situation. The dashboard still shows your real percentages whatever target you choose.
Enter your income, tag each expense as a need, want or saving, and check your split against the rule. The dashboard then shows your real Needs % and Savings %. The 50/30/20 budget is the easiest way to keep your money balanced, so you save steadily, cover the essentials and still enjoy the things you want.