

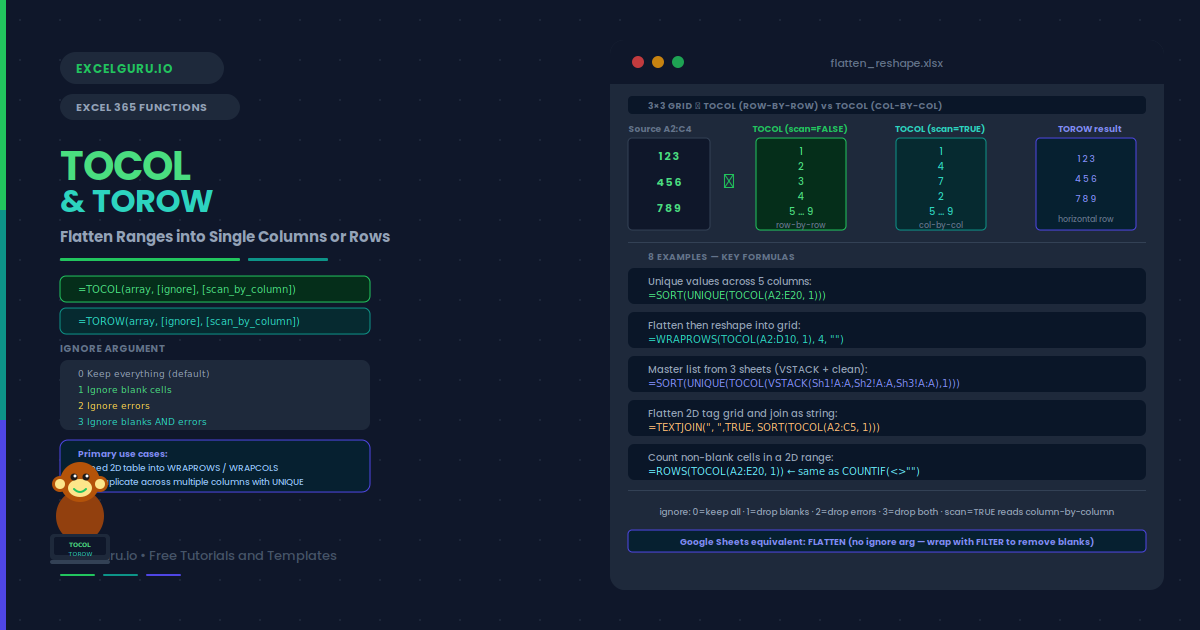
FILTER returns a table. WRAPROWS needs a column. UNIQUE works best on a flat list. TOCOL is the missing link — it flattens any 2D range into a single column in one formula. TOROW does the same into a single row. This guide covers eight examples: basic flattening with row-by-row vs column-by-column scan direction, all four ignore values for removing blanks and errors, stacking multiple columns for cross-column UNIQUE deduplication, converting rows to columns for SORT, the TOCOL+WRAPROWS flatten-then-reshape pipeline, building a master list from multiple sheets using VSTACK+TOCOL, feeding a 2D tag grid into TEXTJOIN, and deduplicating values across five columns for a dynamic dropdown source.

A cell contains “Alice, Bob; Carol” — TEXTSPLIT splits it into three separate values in one formula. It is fully dynamic, updates when the source changes, and handles multiple delimiters in a single call. This guide covers eight examples: splitting by a single delimiter into columns or rows, using multiple delimiters as an array with TRIM via LET, 2D splits with both row and column delimiters, Key=Value pair parsing with CHOOSECOLS and VLOOKUP, in-cell CSV parsing with DROP and SORT, counting and extracting tokens by index, case-insensitive splitting for natural language data, and a complete split-clean-sort-rejoin pipeline using LET, TRIM, SORT, and TEXTJOIN.
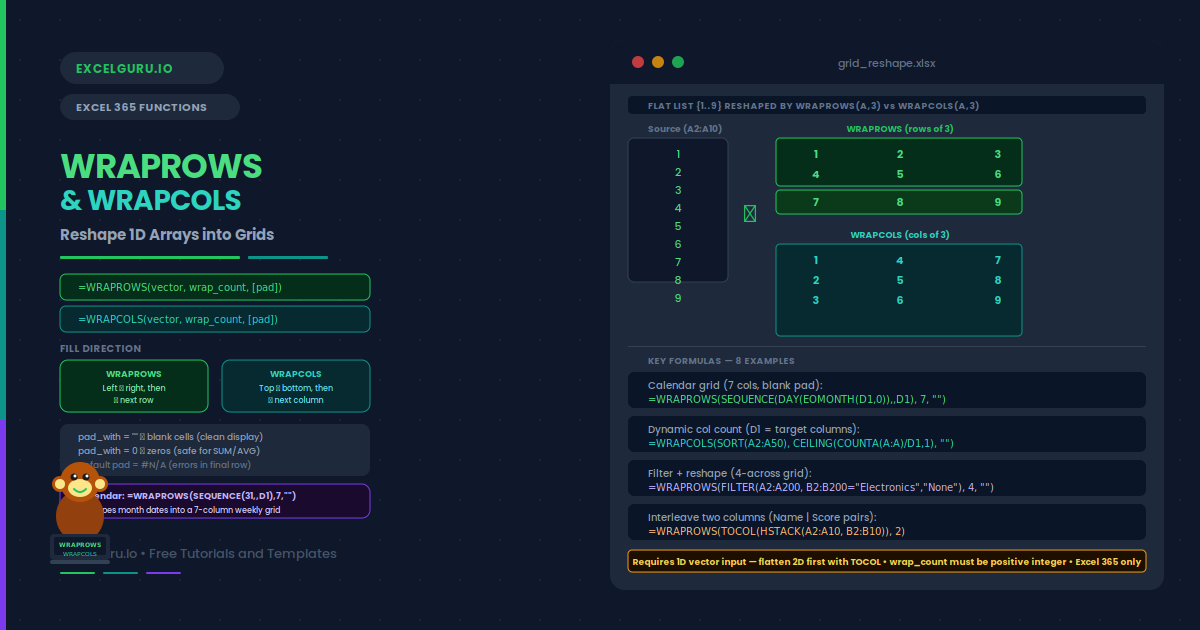
A flat list of 12 months becomes a 3×4 calendar grid. A 50-item product column reshapes into a 5×10 display table. WRAPROWS and WRAPCOLS perform this transformation in one formula. WRAPROWS fills left-to-right and wraps to the next row. WRAPCOLS fills top-to-bottom and wraps to the next column. This guide covers eight examples: basic grid reshaping with scan direction comparison, controlling the pad_with argument for partial rows, a dynamic self-updating calendar using SEQUENCE, a product catalogue display grid, filtered display grids via WRAPROWS+FILTER, pairing two columns with TOCOL+HSTACK, reshaping survey data into a month-by-question grid, and a dynamic wrap count that auto-resizes to a target number of columns.
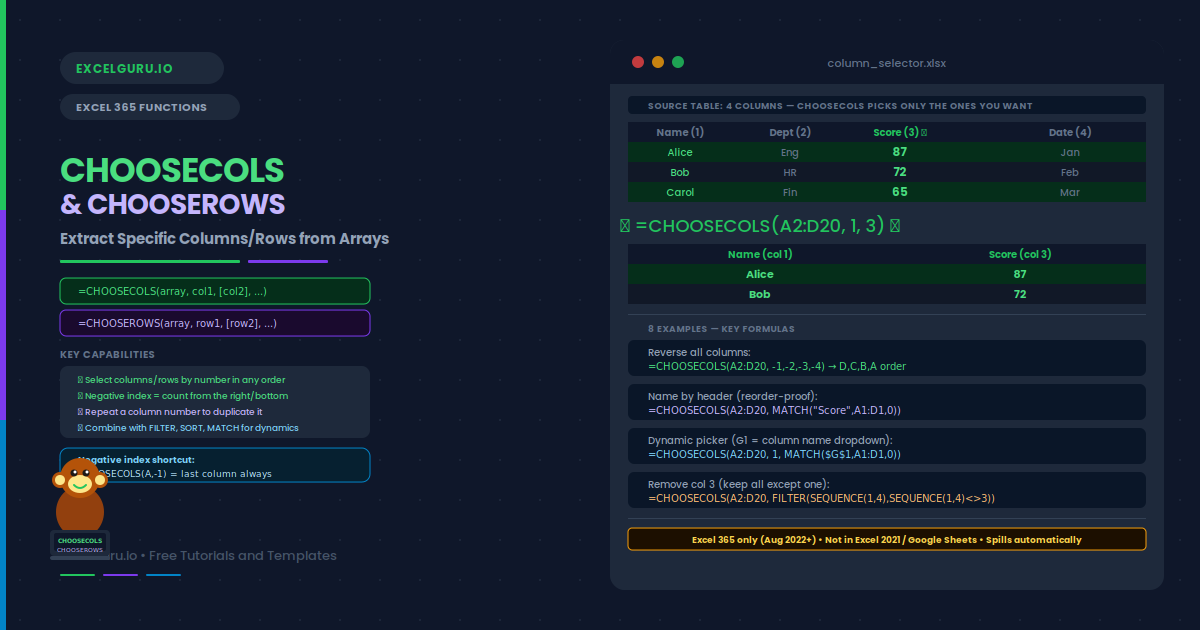
INDEX retrieves values from a table by row and column number. CHOOSECOLS and CHOOSEROWS do the same for entire columns and rows — and they do it in a single readable call. Pass the array and a list of column or row numbers, and the function returns exactly those columns or rows in the order you specify. Negative numbers count from the end, so you never need to know the total width. This guide covers eight examples: selecting named columns by position, reversing and duplicating columns, CHOOSECOLS on FILTER output, a dynamic column picker driven by a dropdown, CHOOSEROWS for specific and alternating rows, combining both functions for rectangular sub-table extraction, removing a column with SEQUENCE+FILTER, and selecting columns by header name using MATCH for reorder-proof formulas.
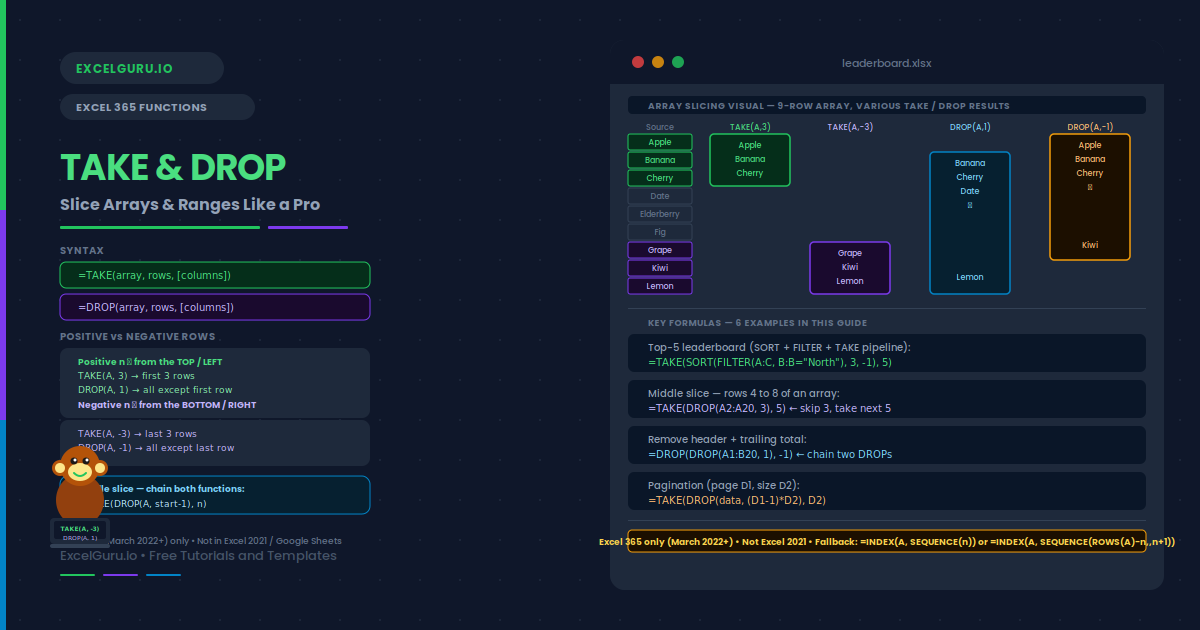
FILTER returns everything that matches. SORT returns everything reordered. But sometimes you only want the first five rows, or everything except the last three, or a specific middle segment. TAKE and DROP fill this gap in Excel 365. TAKE keeps a specified number of rows or columns from either end of an array. DROP removes a specified number and returns the rest. Negative numbers work from the bottom, so you never need to know the total row count. This guide covers six practical examples: first and last N rows with positive and negative arguments, stripping header and footer rows with DROP, extracting a middle slice by chaining DROP and TAKE, two-dimensional slicing with both rows and columns arguments, a SORT+FILTER+TAKE pipeline for a self-updating top-5 leaderboard, and in-worksheet pagination where a page number cell controls which block of rows is displayed. It also covers the pre-TAKE workarounds using INDEX and SEQUENCE, so you can understand what these two functions replace and choose the right approach for your Excel version.
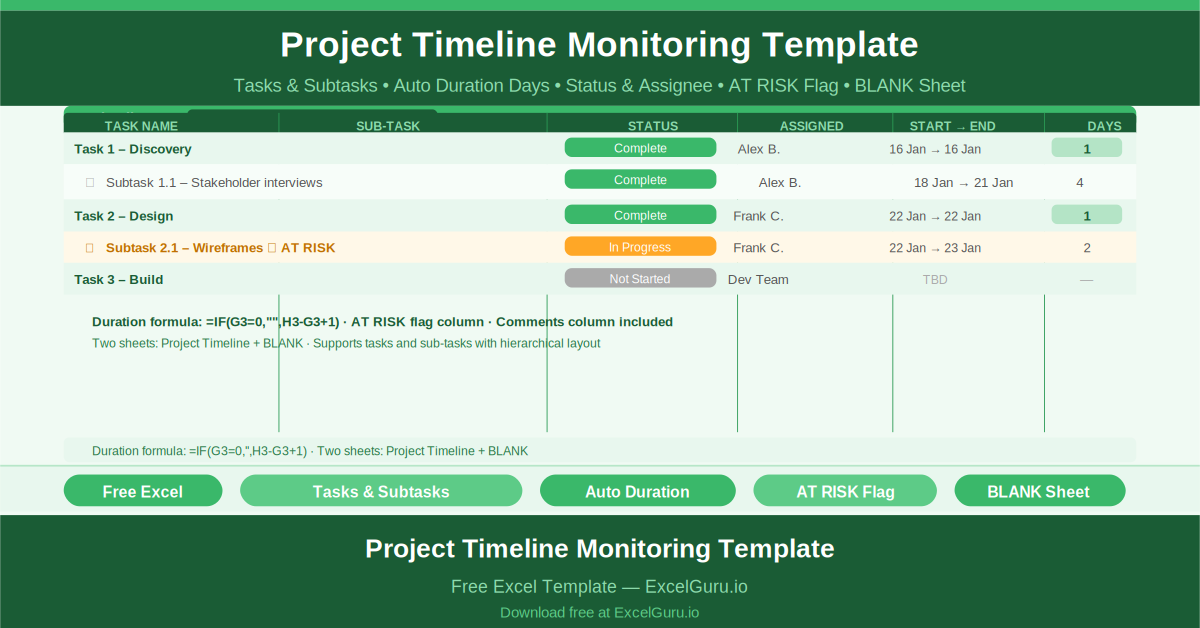
Monitor project timelines with a two‑level task hierarchy (phases and subtasks). Enter start dates and durations; the template calculates end dates and highlights overdue items in red. A Gantt‑style conditional formatting bar shows progress visually. Use the built‑in “at‑risk” flag to tag tasks that might slip. This is ideal for project coordinators who need an early warning system before small delays cascade into missed milestones.
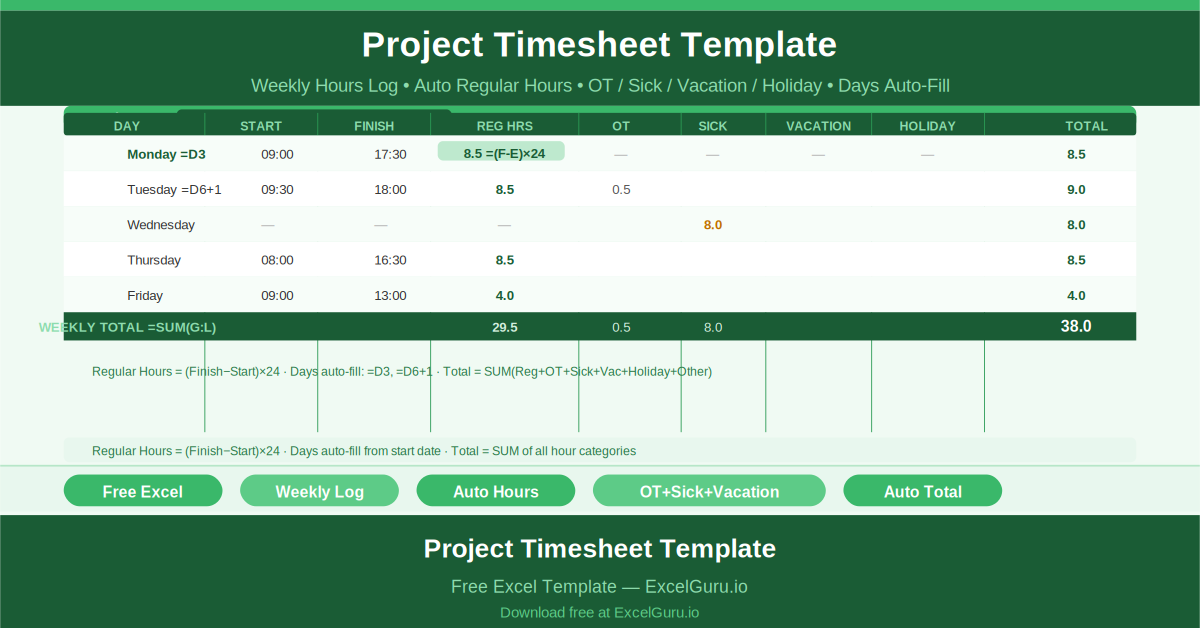
Track team hours accurately with this daily timesheet template. Workers enter start time, end time, and break duration; regular hours calculate automatically. Separate columns capture overtime, sick leave, vacation, and holiday hours. A weekly summary shows total billable vs. non‑billable time. Perfect for small agencies, contractors, or internal project teams that need to track effort for payroll, client billing, or capacity planning.