Excel Function

The Excel Function archives at excelguru.io deliver practical, example-driven tutorials designed to help you move beyond basic formulas. This collection focuses on how to apply essential functions to real-world tasks, featuring in-depth guides on modern lookup tools like XLOOKUP and INDEX MATCH, conditional logic with IFS, COUNTIFS, and SUMIFS, as well as powerful data analysis functions such as SUMPRODUCT and FILTER. Each guide provides clear syntax breakdowns, side-by-side comparisons, and ready-to-copy formulas suitable for every Excel version from 2003 to Microsoft 365.

Whether you need to calculate employee tenure with DATEDIF, build dynamic reports that spill results automatically, or clean up messy spreadsheets using IFERROR, these tutorials offer step-by-step solutions. The content addresses common pain points like nested IF complexity, VLOOKUP limitations, and multi-condition aggregations, ensuring you can handle tasks ranging from commission tiers and grade scales to payroll sheets and date-based grouping—all without relying on helper columns or VBA.

Designed for business professionals, data analysts, and Excel users at all skill levels, this archive transforms how you work with data. Each post includes sample datasets, practical use cases, and expert tips to help you build cleaner, more efficient spreadsheets. Explore the full collection to master the functions that drive accurate reporting, streamlined workflows, and confident data analysis.

Custom Views in Excel tutorial showing saved worksheet layouts filters print settings and reporting views

Custom Views: Save & Switch Between Different Display Settings

Save and switch between different worksheet views with Excel Custom Views. This tutorial explains how to create custom views, preserve print settings, filters, hidden rows, hidden columns, page setup, and reporting layouts for faster workbook navigation. Ideal for Excel users, analysts, finance teams, admin staff, and professionals who need an easy way to manage multiple views of the same workbook.

Data Validation in Excel tutorial showing dropdown lists input rules error alerts and spreadsheet controls

Data Validation: Create Dropdowns from Tables & Dynamic Named Ranges

Control data entry and reduce spreadsheet errors with Excel Data Validation. This tutorial explains how to create dropdown lists, set input rules, restrict values, show input messages, display error alerts, and manage validation settings across worksheets. Ideal for Excel users, analysts, finance teams, admin staff, and professionals who want cleaner data, better controls, and more reliable spreadsheets.

Advanced Filter in Excel tutorial showing criteria ranges unique records filtered data and copied results

Advanced Filter: Extract Unique Records & Complex Criteria

Filter Excel data more powerfully with the Advanced Filter tool. This tutorial explains how to set up criteria ranges, filter records in place, copy results to another location, extract unique values, and apply multiple conditions to large datasets. Ideal for Excel users, analysts, finance teams, admin staff, and professionals who need a faster way to clean, filter, and analyze structured data.

Excel Subtotal Data tab tutorial showing auto outline grouped summaries category totals and report structure

Subtotal (Data Tab): Auto Outline & Group Summaries

Create quick grouped summaries in Excel using the Subtotal tool from the Data tab. This tutorial explains how to sort data, apply subtotals, group rows automatically, use outline levels, summarize by category, and remove subtotals when needed. Ideal for Excel users, analysts, finance teams, admin staff, and professionals who need an easy way to summarize large datasets without building formulas manually.

Excel tutorial for consolidating data from multiple sheets using formulas Power Query and consolidation tools

Consolidate Data from Multiple Sheets (No Formulas Needed)

Combine data from multiple Excel sheets into one organized report with this practical tutorial. Learn how to consolidate worksheets using Excel formulas, Power Query, built-in consolidation tools, consistent headers, and clean data structures. Ideal for Excel users, analysts, finance teams, admin staff, and professionals who need an easy way to merge data across sheets and create reliable summary reports.

Excel tutorial for extracting combining and cleaning data using formulas Power Query and data preparation tools

Extract, Combine & Clean Data Without Formulas

Clean and prepare messy Excel data with this practical tutorial on extracting, combining, and organizing information. Learn how to split text, combine columns, remove duplicates, standardize formats, clean extra spaces, and use Excel tools or Power Query to prepare data for reporting and analysis. Ideal for Excel users, analysts, finance teams, admin staff, and professionals who work with raw data and need a faster way to make it usable.

Quick Analysis Tool in Excel showing formatting charts totals tables and data insights

Quick Analysis Tool: Instantly Create Charts, Totals & Sparklines

Analyze Excel data faster with the Quick Analysis Tool. This tutorial explains how to use Quick Analysis for conditional formatting, charts, totals, tables, sparklines, and quick data insights without building everything manually. Ideal for Excel users, students, analysts, finance teams, and professionals who want a faster way to format, summarize, and visualize data.

Excel Forecast Sheet tutorial showing one-click time series forecasting and trend projection

Forecast Sheet: One‑Click Time Series Forecasting (Excel 2016+)

Create quick time series forecasts in Excel with the Forecast Sheet feature. This tutorial explains how to select historical data, generate forecast charts, adjust forecast end dates, review confidence intervals, handle seasonality, and interpret future trend projections. Ideal for Excel users, analysts, finance teams, sales teams, and business professionals who want an easy way to forecast future values without complex formulas.

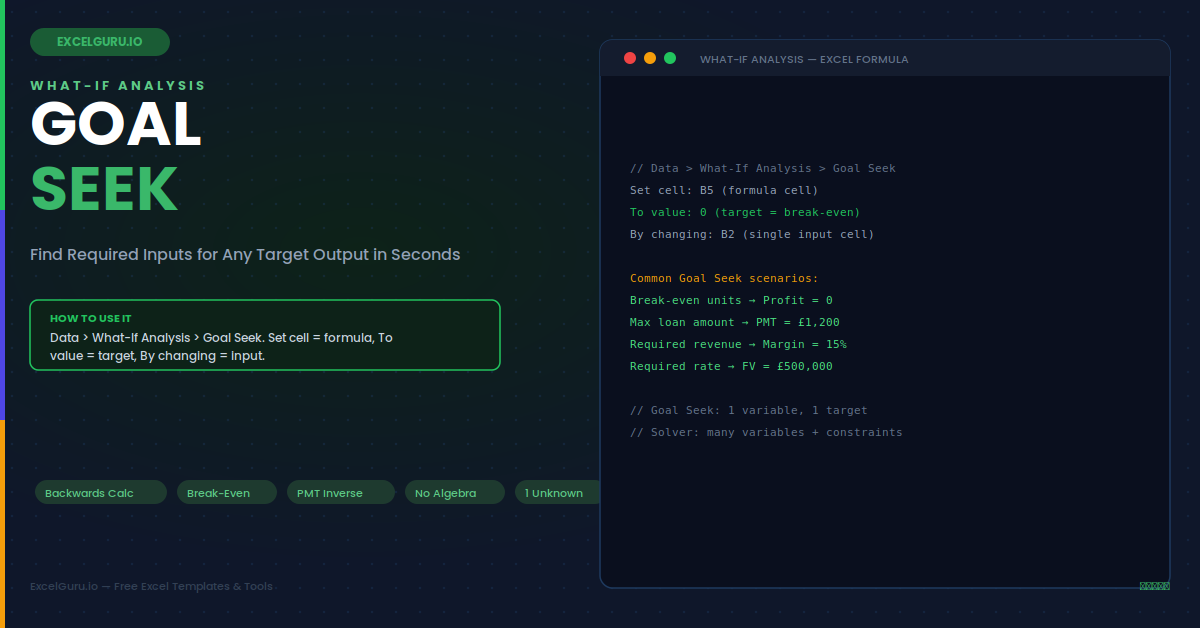
Analyze different business outcomes with Excel Scenario Manager and what-if analysis. This tutorial explains how to create scenarios, change input values, compare results, generate scenario summaries, and test different assumptions in one workbook. Ideal for Excel users, analysts, finance teams, business owners, and students who want an easy way to evaluate best-case, worst-case, and expected-case scenarios.

Compare Multiple Business Scenarios Side‑by‑Side

Analyze different business outcomes with Excel Scenario Manager and what-if analysis. This tutorial explains how to create scenarios, change input values, compare results, generate scenario summaries, and test different assumptions in one workbook. Ideal for Excel users, analysts, finance teams, business owners, and students who want an easy way to evaluate best-case, worst-case, and expected-case scenarios.

CUBEVALUE & CUBESET: Query Data Model from Formulas

Understand how Excel CUBEVALUE and CUBESET functions work with Power Pivot and data models in this practical tutorial. Learn how to retrieve specific values, define member sets, build dynamic reports, connect formulas to slicers, and create flexible dashboard calculations. Ideal for Excel users, analysts, finance teams, and Power Pivot learners who want to build advanced reports using cube functions.

Power Query Fill Down feature image showing a before-and-after HR report where the Department column had null cells below Engineering and Finance labels, and after Fill Down every row shows the correct department name in green or purple, alongside the Table.FillDown M code, a Fill Up example showing a Travel footer label propagated upward, six example pills including merged cells fix and running total, and a warning that Fill Down crosses group boundaries if blank separator rows are not removed first.

Power Query: Fill Down & Fill Up to Replace Nulls with Above or Below Values

Exported reports often put a category label in the first row of each group and leave blank cells below for all other rows in that group. This looks tidy in a formatted report but breaks every formula and PivotTable that expects each row to be self-contained. Fill Down fixes it instantly — it replaces every null with the last non-null value above it, propagating the label through all rows in the group. Fill Up does the reverse, pushing a footer label upward through null cells above it. The critical detail most users miss: Fill Down only replaces null, not empty strings. This guide covers the five-step workflow, how to convert empty strings to null before filling, how to prevent Fill Down from bleeding across group boundaries, and six examples including classic category propagation, merged-cell repair, footer label fill-up, multi-column simultaneous fill, and a running balance using List.Accumulate.

Power Query Group By feature image showing a grouped sales summary table with North GBP 88,500 revenue, 342 orders, and GBP 258.77 average order value, alongside the Table.Group M code for multiple aggregations, the advanced multi-column grouping pattern using Region and Product, the distinct count formula using Table.Distinct inside the group expression, and six example pills including SUMIF equivalent and weighted average.

Power Query Group By: Sum, Count, Average, and Custom Aggregations

Fifty thousand transaction rows need to become a clean summary — total revenue by region, order count by product, average order value by month. Power Query’s Group By builds this in a few clicks and delivers a real flat table you can load anywhere, merge into other queries, or use as a lookup source. Advanced mode lets you add multiple group columns and multiple aggregations simultaneously. The All Rows aggregation type unlocks custom M expressions for patterns the UI doesn’t natively support — distinct customer counts, SUMIF-style conditional sums, and weighted averages. This guide covers both Basic and Advanced mode, six worked examples including regional revenue summaries, multi-metric aggregations, distinct customer counts, conditional aggregation using Table.SelectRows inside a group, and a revenue-weighted average price pattern.