You finish the fiscal year with a stack of spreadsheets. One sheet holds individual targets. Another contains actual sales results. A third shows percentages. Pulling together a ranked list of your sales team takes hours of manual copying, pasting, and calculating. Worse, you never know if the numbers are current.
The annual sales staff ranking template solves this by placing everything in one clean table. You enter each salesperson’s target and actual result. The template calculates the completion rate automatically. Total rows sum everything instantly. No more manual formulas. No more out‑of‑sync reports.
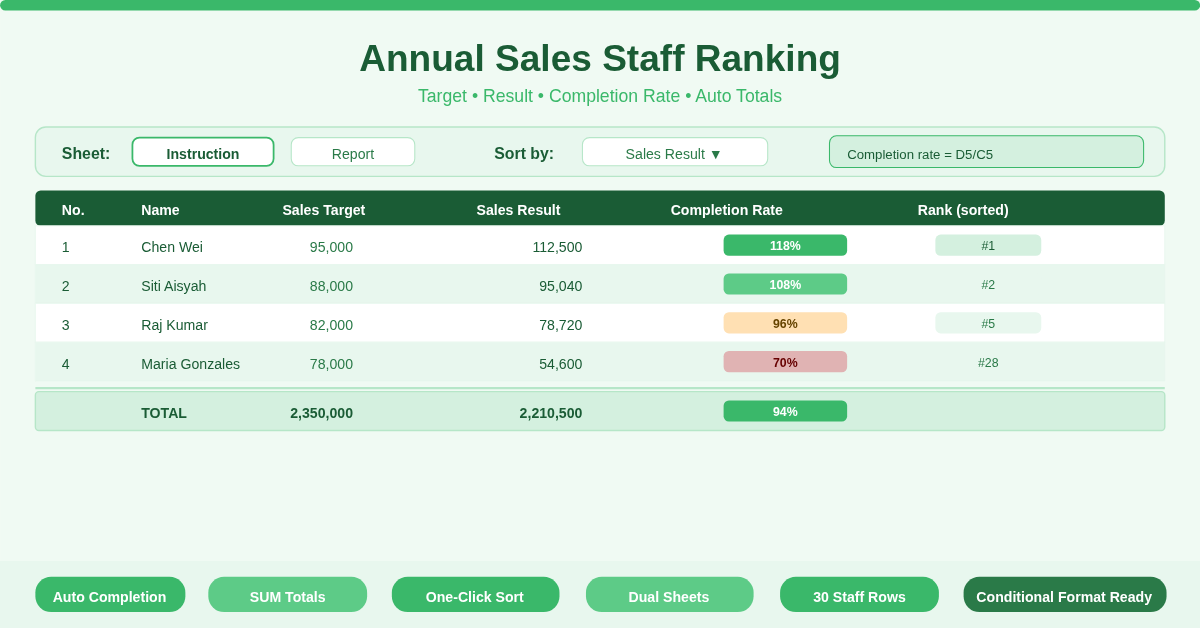
What Is the Annual Sales Staff Ranking Template?
This template is a dedicated Excel workbook for ranking sales team members by annual performance. It serves sales managers, team leads, HR departments, and business owners who need a quick, accurate view of who hits targets and who misses.
The workbook includes two sheets:
- Instruction sheet – Contains sample data showing exactly how the template works. Use it to practice or as a reference.
- Report sheet – Your live ranking table. Replace sample names and numbers with your actual team data.
Each sheet contains seven columns:
| No. | Name | Sales Target | Sales Result | Completion Rate | Sales Performance | Rate of Completion |
The Sales Performance column simply repeats the Sales Result (useful for sorting or conditional formatting). The Completion Rate and Rate of Completion columns both show the same percentage (target vs. result). This redundancy allows you to use one column for conditional formatting (e.g., colour‑coded icons) while keeping the other for pure data.
Automatic Completion Rate Calculation
The template uses a simple division formula to calculate each salesperson’s completion rate. In row 5 (the first data row), the formula is:
=D5/C5
Here is what it does. It takes the Sales Result (cell D5) and divides it by the Sales Target (cell C5). The result is a decimal number. For example, if a salesperson achieves 65,518 target, the formula returns 1.18 (118% completion).
Format the column as a percentage to see “118%” instead of “1.18”. The template includes the same formula in the Rate of Completion column (column G), so you have two identical percentage columns. Consequently, you can apply a traffic‑light conditional format to one column and keep the other as raw numbers.
The Total row at the bottom of each sheet also calculates an overall completion rate for the entire team:
=D35/C35 (where D35 sums all Sales Results and C35 sums all Sales Targets)
This gives you the team’s aggregate performance in one glance.
Dual Sheets for Testing and Reporting
Many templates force you to work directly on the main data. The annual sales staff ranking template gives you a separate Instruction sheet filled with sample numbers.
Why this matters. You can practice formulas, test sorting, and experiment with conditional formatting on the Instruction sheet without risking your real report. Once you are confident, switch to the Report sheet and enter your actual staff names, targets, and results.
The structure is identical on both sheets. Therefore, any formatting or formula adjustments you make on the Instruction sheet can be copied directly to the Report sheet. This separation also allows you to keep historical data. For example, save the Report sheet as “FY2024” and start a fresh “FY2025” by copying the Instruction sheet template.
Simple Ranking Without Complex Functions
The template does not use RANK or SORT functions by default. Instead, it relies on a clean table structure that works with Excel’s built‑in sorting and filtering.
How to rank your staff instantly:
- Select any cell in the Sales Result column.
- Click Data → Sort → Largest to Smallest.
- Excel reorders the entire table by actual sales performance.
Similarly, you can rank by Completion Rate to see who exceeded their target by the biggest margin, or by Sales Target to compare difficulty levels. Because the table includes a sequential “No.” column, you can always reset to original order by sorting by that column.
This approach avoids complex array formulas that break when you add or remove staff. It also works perfectly in Google Sheets.
How Do the SUM Totals Actually Work?
At the bottom of the table, the template calculates total Sales Target and total Sales Result using SUM formulas:
=SUM(C5:C34) – adds all individual targets.
=SUM(D5:D34) – adds all individual results.
These totals automatically update when you add or change values. Use them to track team‑wide progress against the annual goal.
The overall Completion Rate in the Total row divides the total results by total targets. This gives a weighted average completion rate. For example, if your team has a total target of 1,800,000, the total completion rate shows 90%. Note that this is different from averaging each individual’s completion rate. The weighted view is more accurate for team performance.
Practical Use Cases
Sales Manager at a Retail Chain – Enter 30 stores as “staff”. Compare each store’s annual target vs. actual revenue. Sort by Sales Result to identify top and bottom performers instantly. Use the total row to track regional performance across all locations.
HR Business Partner – Use the template to rank sales staff for bonus calculations. The Completion Rate column (as a percentage) determines payout tiers. Export the ranked table to your payroll system.
Small Business Owner – Manage a team of five销售人员. Enter targets at the start of the year. Update Sales Result monthly. The running total row shows you whether the company is on track without calculating manually.
Sales Operations Analyst – Copy the Report sheet to create quarterly versions (Q1, Q2, Q3, Q4). Use the Instruction sheet to test different target allocation scenarios before committing to annual goals.
Team Lead Monitoring Individual Performance – Filter by Completion Rate below 80% to identify struggling team members early. Offer coaching before the year ends.
How to Set Up and Start Using the Template
Follow these steps to deploy the ranking template for your team:
- Download the Excel file from the link below. Open the Instruction sheet first.
- Review the sample data (Name01 to Name30). Notice how the Completion Rate updates automatically when you change a target or result.
- Click on the Report sheet tab. This is your working sheet.
- Replace “Name01”, “Name02”, etc. with your actual staff names.
- Enter each person’s annual sales target in column C (Sales Target).
- Enter their actual year‑to‑date or final sales result in column D (Sales Result).
- Observe columns E and G fill automatically with completion rates.
- Scroll to the Total row (row 35). Verify the SUM formulas include all your staff. If you have fewer than 30 staff, delete the unused rows but keep the Total row formula intact.
- Sort the table by Sales Result (largest to smallest) to see your ranked order.
- Format the Completion Rate column as percentage with one decimal place (Home → Number → Percentage).
To reset to original order, sort by the “No.” column.
How to Add Conditional Formatting for Visual Ranking
The template does not include built‑in conditional formatting, but you can add it in two minutes.
To color‑code Completion Rate:
- Select column E (Completion Rate).
- Click Home → Conditional Formatting → New Rule → Format only cells that contain.
- Set “Cell Value” → “greater than or equal to” → “1” (100%). Choose green fill.
- Add another rule for “less than 0.8” (80%). Choose red fill.
To highlight top three sales results:
- Select column D (Sales Result).
- Click Conditional Formatting → Top/Bottom Rules → Top 10 Items. Change “10” to “3”.
- Choose a gold or blue fill.
These visual cues make your annual sales staff ranking template readable at a glance during management presentations.
Download Your Free Annual Sales Staff Ranking Template
Stop calculating completion rates on a calculator. Stop manually summing columns. Download the free annual sales staff ranking template below. It works with Excel 2016, 2019, 365, and Google Sheets. The dual‑sheet design lets you test before committing real data.