Your sales team has twenty active opportunities. Three are leads. Five are proposals. Two are in formal approval. Each opportunity has a different close quarter and a different probability of closing. Your manager asks: “What is our realistic Q2 forecast?” You spend an hour manually multiplying each deal value by its probability, then grouping by quarter. By the time you finish, the numbers are already outdated.
The sales pipeline management template solves this by automating the entire weighted forecast. You enter the account name, pipeline stage, forecast close quarter, and potential opportunity value. The template calculates the chance of sale automatically based on the stage. Then it computes the weighted forecast and splits it into Q1, Q2, Q3, and Q4 columns. Total rows sum everything instantly.
What Is the Sales Pipeline Management Template?
This template is a dedicated Excel workbook for sales pipeline tracking. It serves sales directors, business development managers, account executives, and startup founders who need a realistic, stage‑based sales forecast.
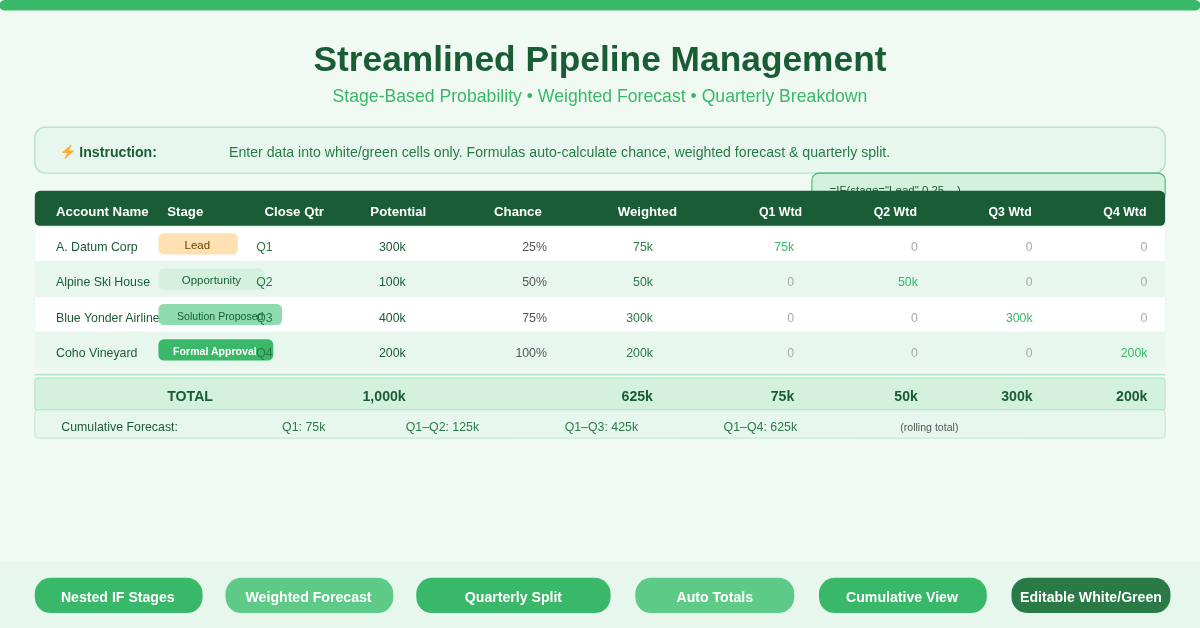
The template contains one master sheet with nine core columns:
| Column | Purpose |
| Account Name | Name of the prospect or client |
| Pipeline Stage | Dropdown/selection: Lead, Opportunity, Solution Proposed, Formal Approval |
| Forecast Close | Quarter when the deal is expected to close (Q1–Q4) |
| Potential Opportunity | Total deal value in your currency |
| Chance of Sale | Automatic percentage based on stage (Lead=25%, Opportunity=50%, Solution Proposed=75%, Formal Approval=100%) |
| Weighted Forecast | Potential Opportunity × Chance of Sale |
| Q1–Q4 Weighted Forecast | Weighted amount allocated to the selected close quarter |
The template also includes a TOTAL row that sums the Potential Opportunity, Weighted Forecast, and each quarter’s weighted forecast. A secondary cumulative row shows running quarterly totals.
Nested IF Formula for Stage‑Based Probability
The Chance of Sale column (column E) uses a nested IF formula that maps each pipeline stage to a specific probability percentage. Here is the exact formula from row 7:
=IF(B7 = “Lead”, 0.25, IF(B7 = “Opportunity”, 0.5, IF(B7 = “Solution Proposed”, 0.75, IF(B7 = “Formal Approval”, 1, -1))))
Here is how it works. When you select “Lead” in column B, the formula returns 0.25 (25%). “Opportunity” returns 0.5 (50%). “Solution Proposed” returns 0.75 (75%). “Formal Approval” returns 1 (100%). Any other value returns -1 (error flag).
This automates a critical sales discipline. Instead of salespeople guessing probabilities, the template enforces standardized rates by stage. Consequently, your forecast becomes consistent and comparable across the whole team.
If your organization uses different percentages, simply edit the numbers in the formula. Change 0.25 to 0.2 for 20%, and so on. The structure remains the same.
Weighted Forecast and Quarterly Allocation
The Weighted Forecast column (column F) multiplies the Potential Opportunity by the Chance of Sale:
=D7 * E7
A 75,000. A 200,000. This weighted number represents the realistic expected revenue from that opportunity.
Then the quarterly columns (G through J) allocate the weighted forecast to the correct quarter using a simple IF statement:
=IF($C7 = “Q1”, $F7, 0) for Q1
=IF($C7 = “Q2”, $F7, 0) for Q2, and so on.
Therefore, if an opportunity has Forecast Close = “Q2”, the full weighted forecast appears only in the Q2 column. All other quarter columns show zero. When you sum the quarter columns at the bottom, you get a clean quarterly pipeline breakdown without manual copying.
Cumulative Quarterly Totals at the Bottom
The template includes two special rows below the main total row:
- Row 29 (labelled TOTAL) sums each quarter column: =SUM(G7:G28) for Q1, etc.
- Row 30 creates cumulative totals: =G29 for Q1, then =G30+H29 for Q1+Q2, then =H30+I29 for Q1+Q2+Q3, then =I30+J29 for all four quarters.
Why does this matter? The cumulative row shows your forecasted pipeline value on a rolling basis. At the start of Q2, the cumulative Q2 number tells you the total expected revenue from Q1 plus Q2 opportunities. This matches how executives think: “What is our year‑to‑date forecast?”
The template also sums the Potential Opportunity column (column D) at the bottom, so you can see your raw pipeline value next to your weighted forecast.
How Do the Stage and Quarter Dropdowns Work?
The template expects you to enter Pipeline Stage and Forecast Close manually (or via Data Validation dropdowns if you add them). The provided sample data uses text values: “Lead”, “Opportunity”, “Solution Proposed”, “Formal Approval” for stage, and “Q1”, “Q2”, “Q3”, “Q4” for close quarter.
To add dropdowns for easier data entry:
- Select the range of cells in column B (starting from row 7).
- Data → Data Validation → Allow: List → Source: Lead, Opportunity, Solution Proposed, Formal Approval.
- Repeat for column C with source: Q1, Q2, Q3, Q4.
This prevents typos that would break the nested IF formulas. The template’s sample data shows correct spelling, so you can copy exactly.
The instructions row (row 5) clearly states: “Enter data into the white and green cells only.” The white cells are Account Name, Pipeline Stage, Forecast Close, and Potential Opportunity. The green cells (not visible in the text preview but implied) are typically editable fields. The calculated columns (E through J) are locked or formula‑protected.
Practical Use Cases for this Sales Project Template
- Sales Director at a B2B SaaS Company – Review the pipeline every Monday. Sort by weighted forecast to see which opportunities matter most. The quarterly columns tell you if Q3 is light. Then you can coach the team to accelerate deals or add new ones.
- Business Development Manager for a Consulting Firm – Use the template for each service line (copy the sheet for “Strategy Consulting”, “Implementation”, “Training”). The cumulative row shows total forecasted revenue by quarter across all service lines.
- Startup Founder Managing the Sales Process – Enter every lead from your CRM into this template. The chance of sale formula forces discipline: a lead is only 25% until qualified. The weighted forecast prevents over‑optimism in board meetings.
- Sales Operations Analyst – Export the template data at the end of each quarter. Compare weighted forecast (column F total) against actual closed revenue. Calculate forecast accuracy by stage. The nested IF formula gives you consistent historical data for analysis.
- Account Executive Tracking Personal Pipeline – Copy the template for your own use. Replace the sample accounts with your real opportunities. The Q1–Q4 columns help you plan which deals to push for quarterly commission targets.
How to Set Up and Start Using the Template
Follow these steps to deploy the pipeline tracker:
- Download the Excel file from the link below. Open the Pipeline Sales Opp. Tracker sheet.
- Review the instruction at row 5. White and green cells are editable. All other cells contain formulas.
- Delete the sample rows (rows 7–28) or overwrite them with your accounts.
- In column A (Account Name), enter your prospect or customer names.
- In column B (Pipeline Stage), type one of: Lead, Opportunity, Solution Proposed, Formal Approval.
- In column C (Forecast Close), type Q1, Q2, Q3, or Q4.
- In column D (Potential Opportunity), enter the total deal value in dollars (or your local currency).
- Watch columns E, F, G, H, I, J populate automatically.
- Scroll to row 29. The TOTAL row shows summed raw pipeline value, weighted forecast, and quarterly totals.
- To add a new row, insert a row above row 29 (the total row). Copy the formulas from an existing row into the new row. Ensure the total row formulas still reference the correct range (adjust if needed).
To change the probability percentages, edit the nested IF formula in column E. For example, change 0.25 to 0.20 for Lead, or add a new stage like “Quote Sent” by extending the IF logic.
Download Your Free Sales Pipeline Management Template
Stop manual weighted forecasts. Stop rebuilding quarterly breakdowns every meeting. Download the free sales pipeline management template below. It works with Excel 2016, 2019, 365, and Google Sheets (with minor adjustments to array formulas). The nested IF logic and quarterly allocation work immediately.